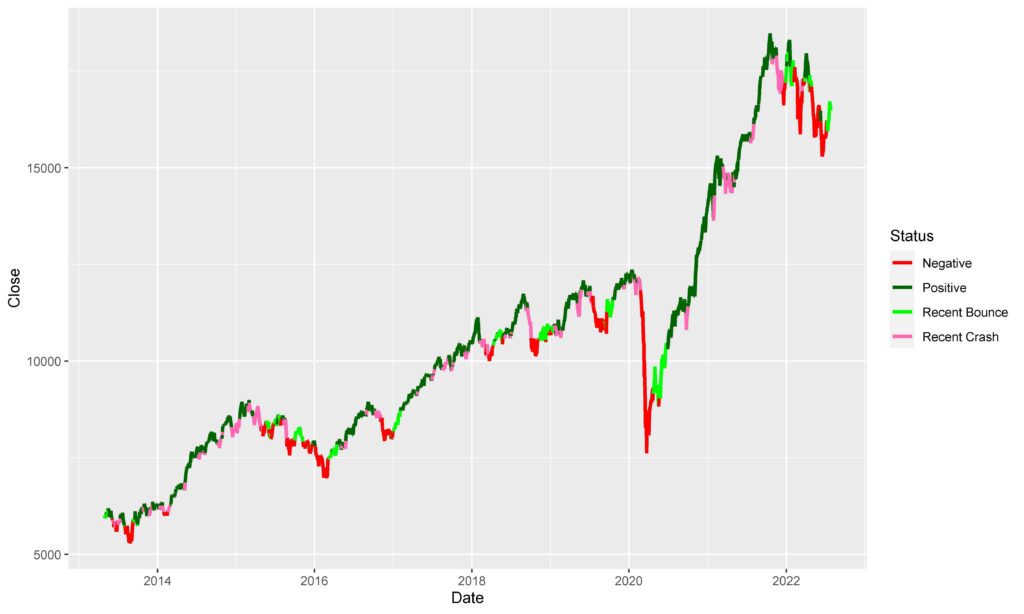
Catching the bounce, not the falling knife
In investments, all strategies can be boiled down to two basic philosophies:1. Something is going up, and you bet it’ll keep going up (Momentum)2. Something is going down, and you bet it’ll reverse course soon (Reversion) The problem with the Momentum strat is that you buy something expensive, hoping it’ll become more expensive (thus needing …