In the last article I put out, conducting a backtest on the AC and LR criteria for stock trend identification and robustness, the process was naive and mainly showcased as a proof of concept, that this signal is viable. Those who missed it, can read it HERE.
The test suffered from multiple limitations, some of which I recognized and pointed out in the article itself. A few that I missed were pointed out by Ankit_Quant and Entropy_Chase on twitter.
The limitations were:
1. No cap on number of stocks to be bought when signal is achieved – “Unlimited Capital problem“
2. The above also prevents comparisons against buy and hold strategies on Index (what capital do you plunk down at the beginning?)
3. The returns were computed by buying on the same day (as opposed to the next day, in a real world scenario)
4. The returns were computed using Close prices (is never a good idea, unless absolutely necessary).
5. If you’re not buying all the stocks recommended, which stock are you buying?
To improve upon this, we put restrictive rules on the backtest:
1. Buy only for 10k at a time (in nominal returns format),or previously accumulated profits (in the compounded format). The lock-out for the next buy is based on the respective hold time (5/20/60 days).
2. Buy price is based on randomly selected stock price between the high and low of next day of the signal. Sell price was similarly randomized on the target date between high and low.
3. Which stock to buy is also randomly selected from the list of stocks giving the signal within respective universe of market caps.
4. Returns are compared to Nifty returns for the backtest period, with 10k invested in Nifty at the beginning of 2002 (final figure for Nifty PnL is Rs. 1,72,562).
Before I present the results, just need to remind that, since the backtest is based on randomly selected stock, the results will vary from test to test. Here, I’m presenting just one such test. The final section of the analysis, encompassing multiple such random paths, will be presented later on, in another article.
As always, the intermediate files generated from the backtest can be downloaded HERE.
For those who don’t wish to read the entirety of the results, here is the TLDR summary of compounded returns of the 4 strategies.
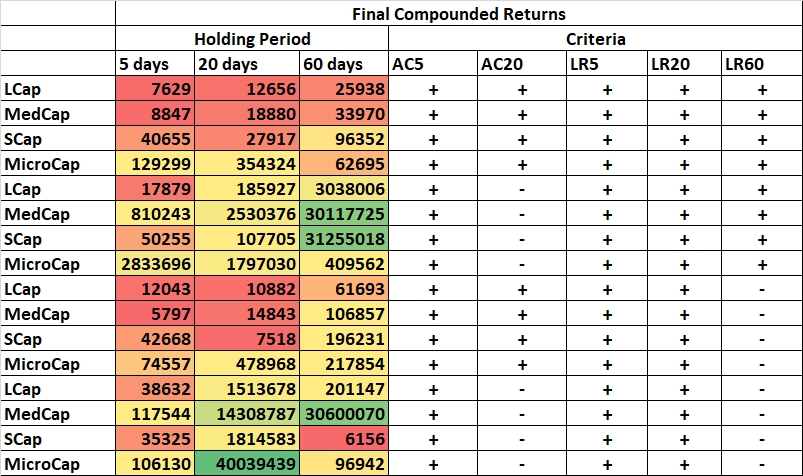
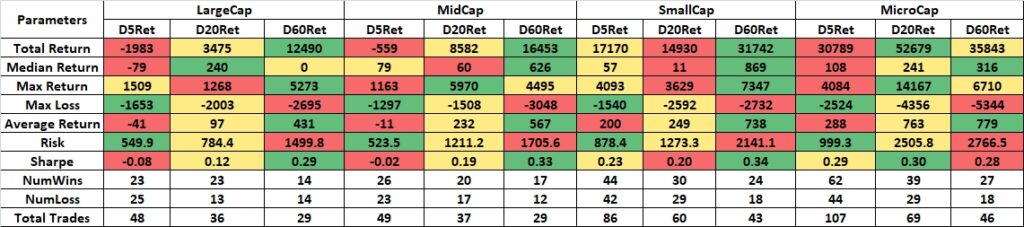
RESULTS
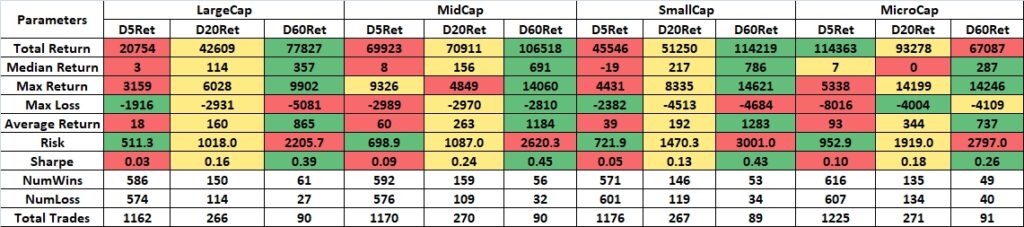
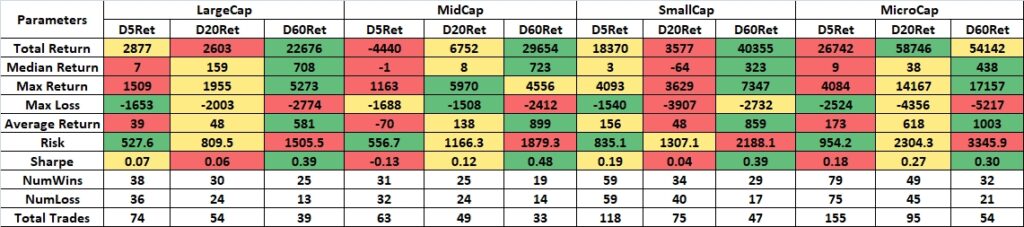
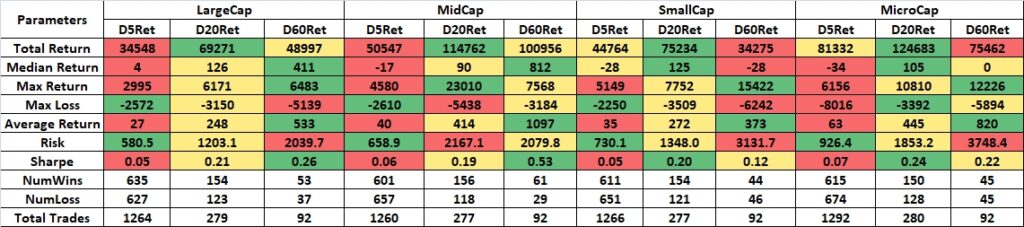
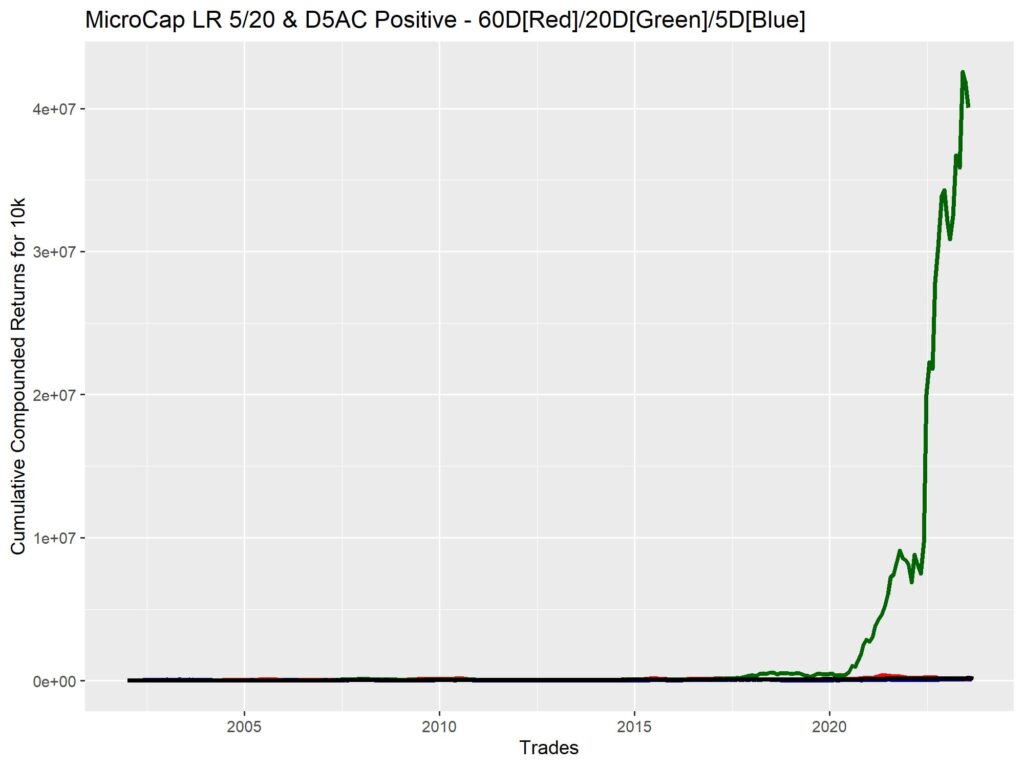
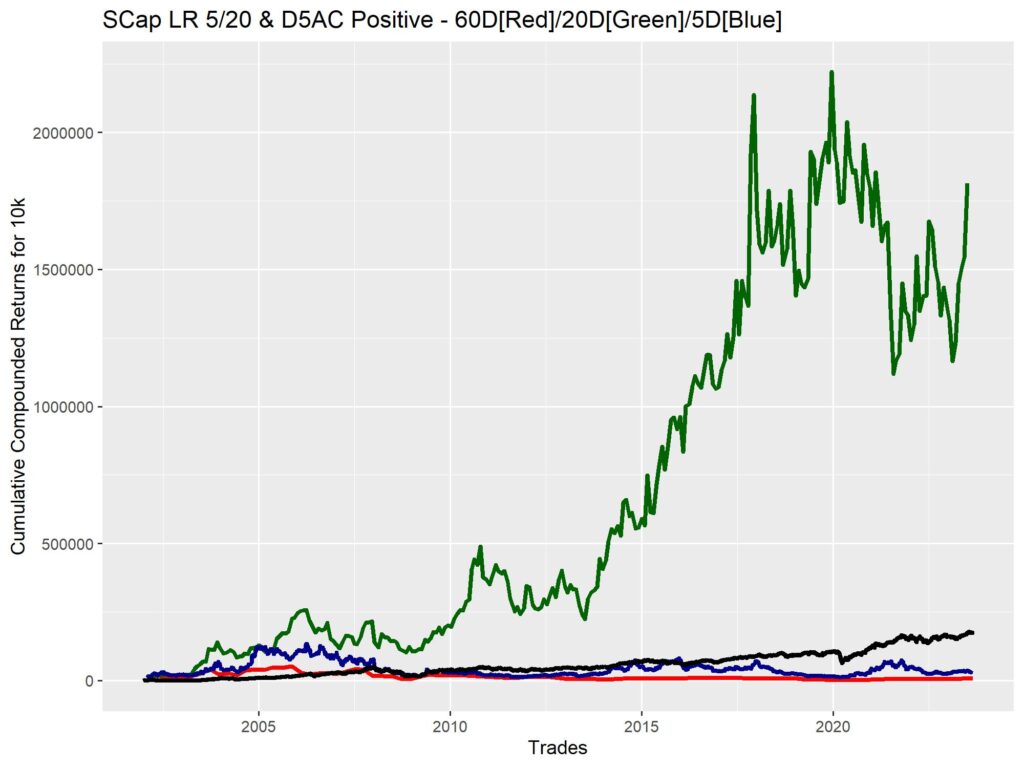
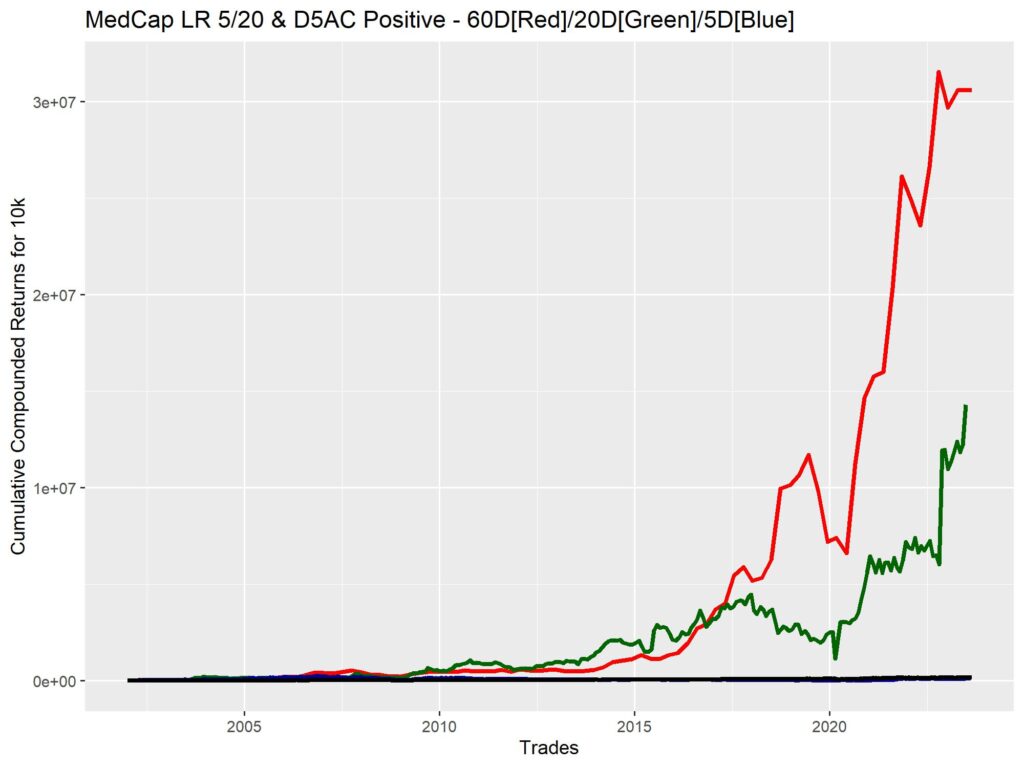
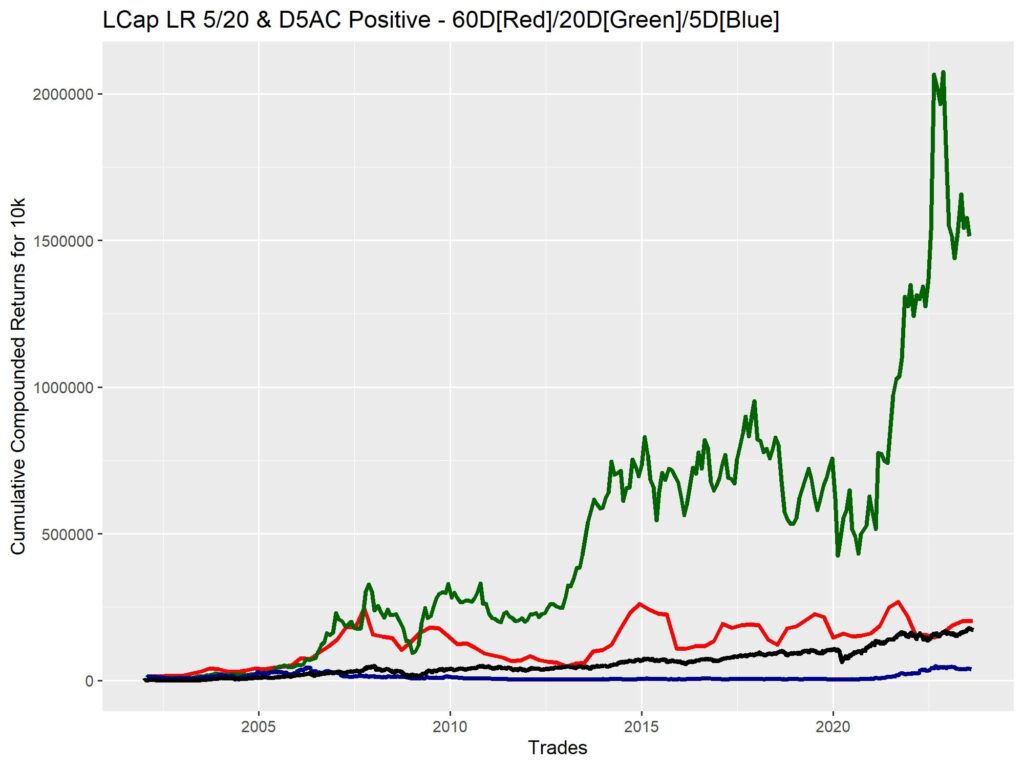
The results will be organized into summary tables for nominal returns, followed by equity curves for compounded returns.
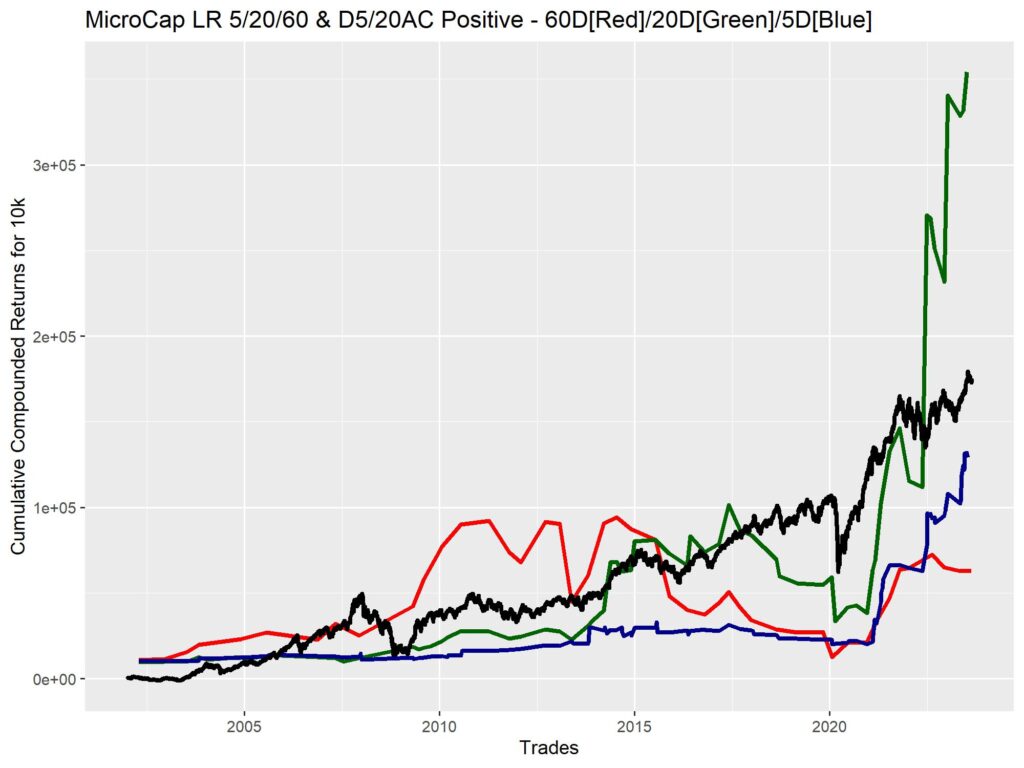
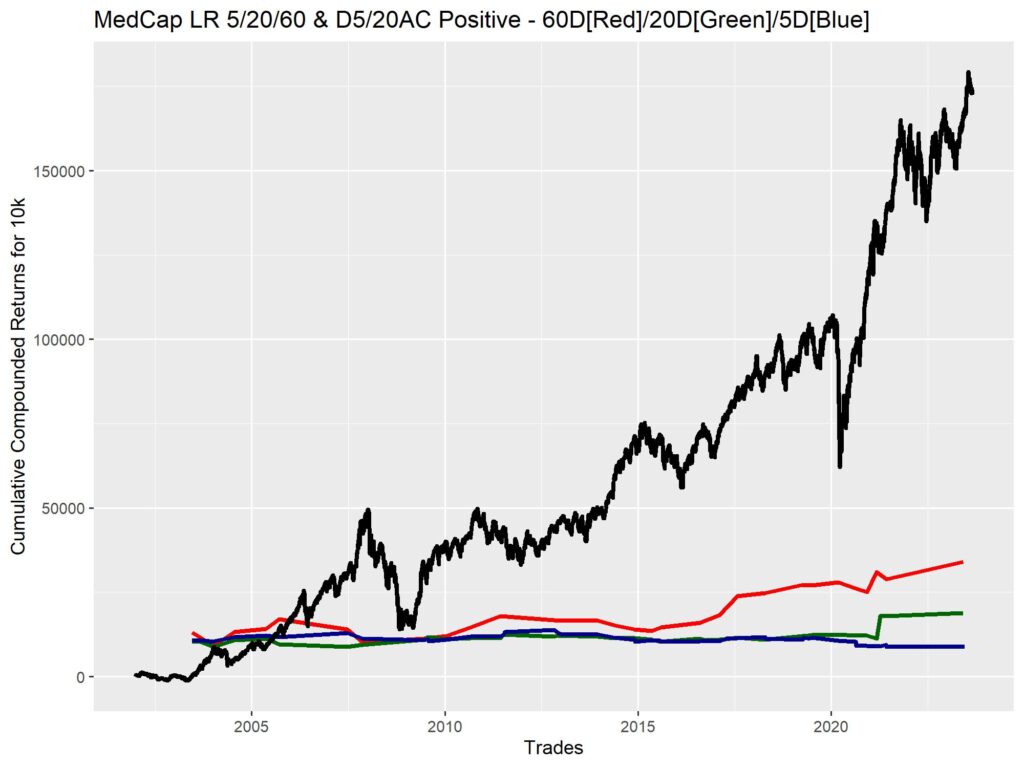
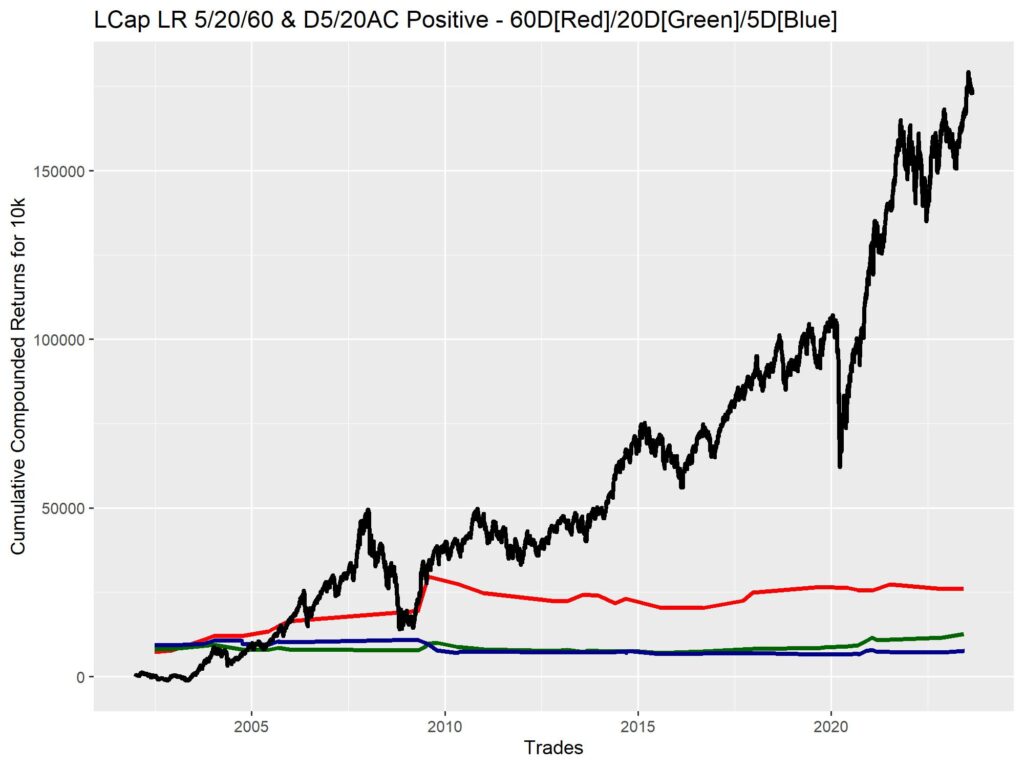
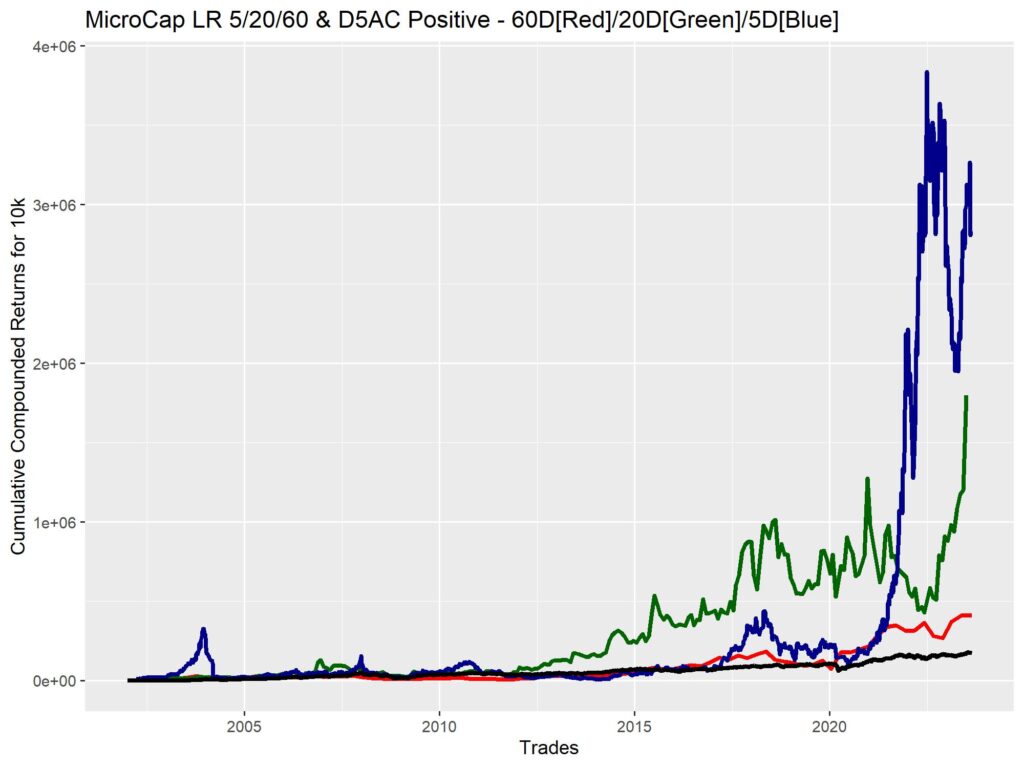
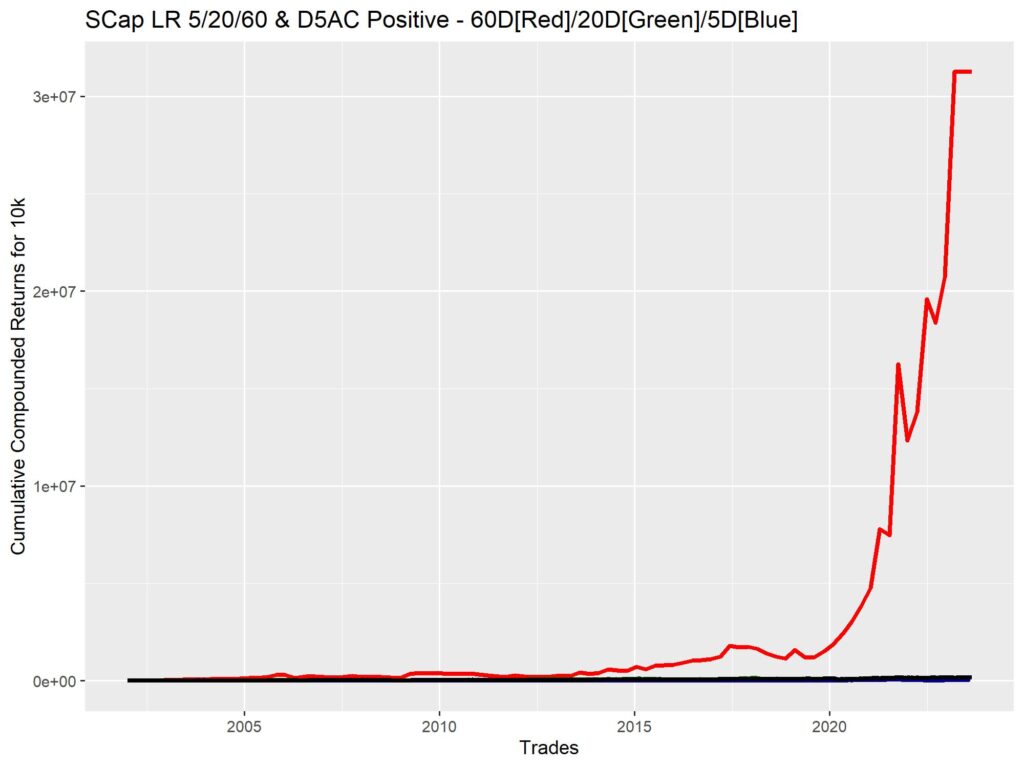
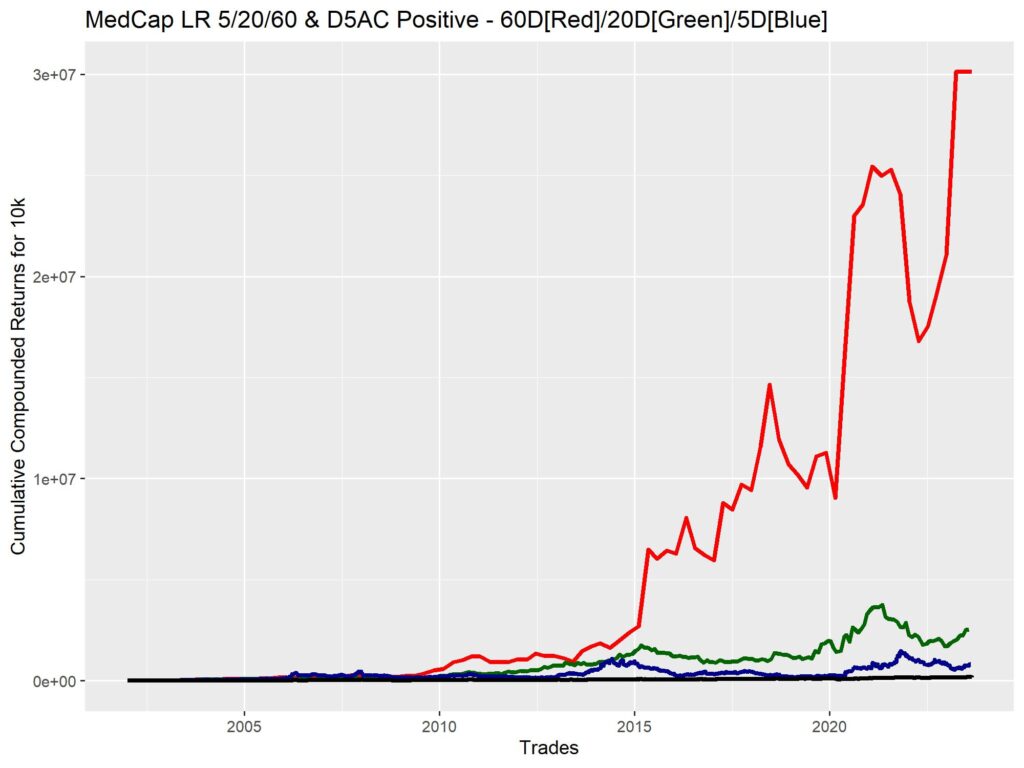
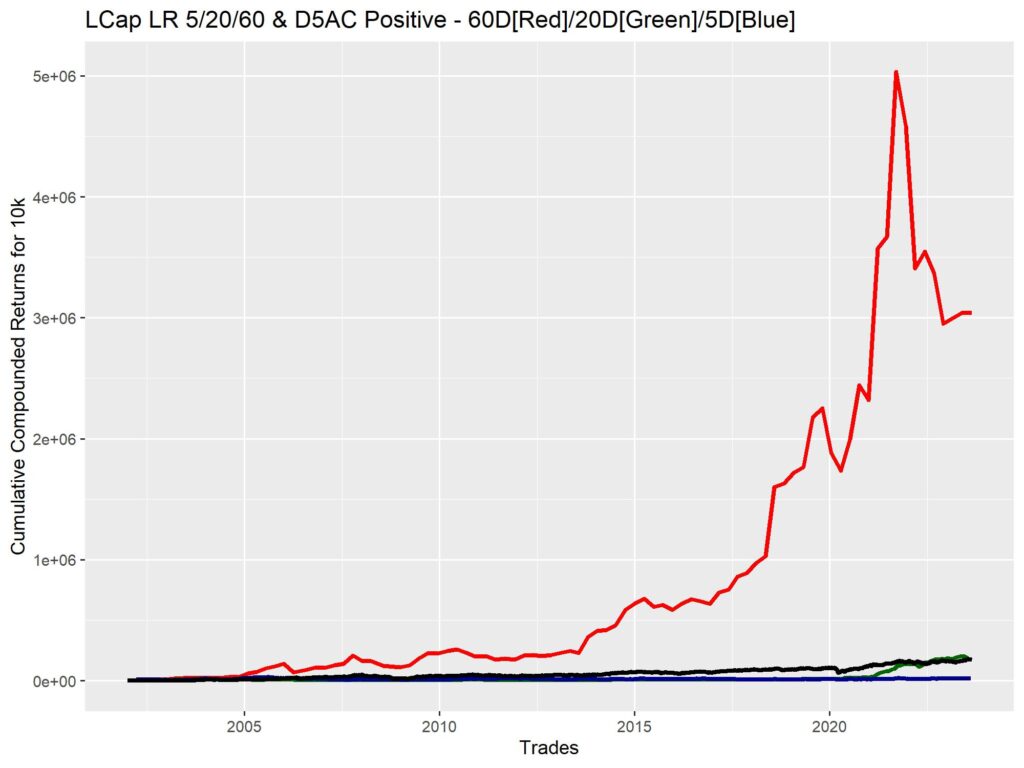
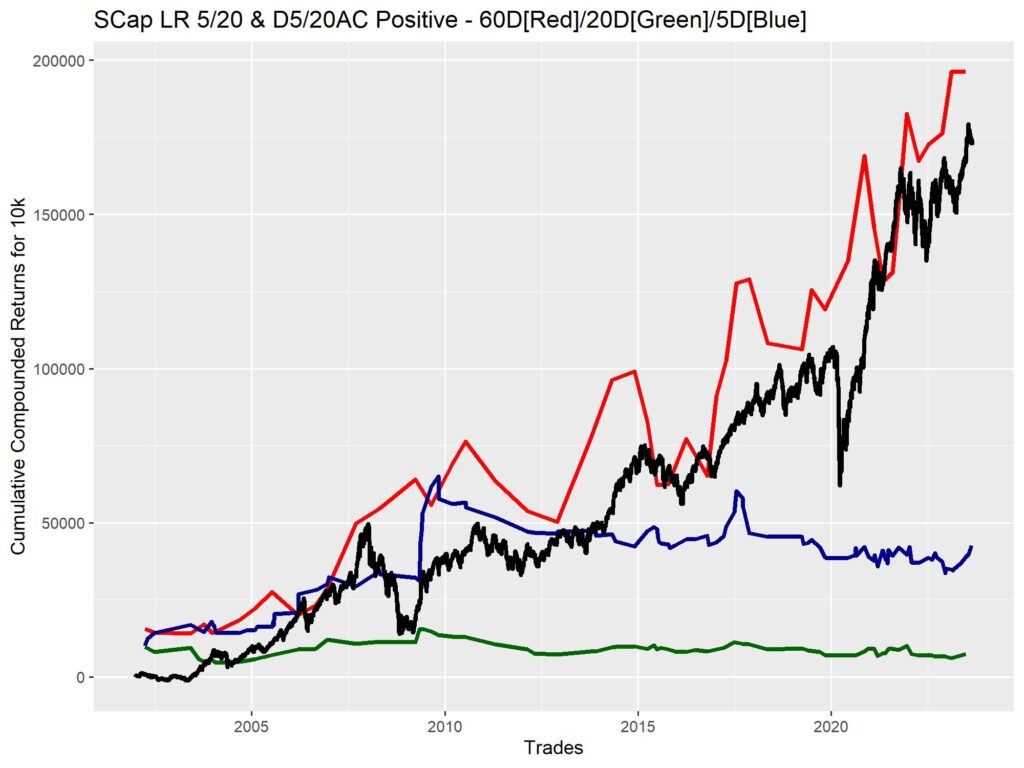
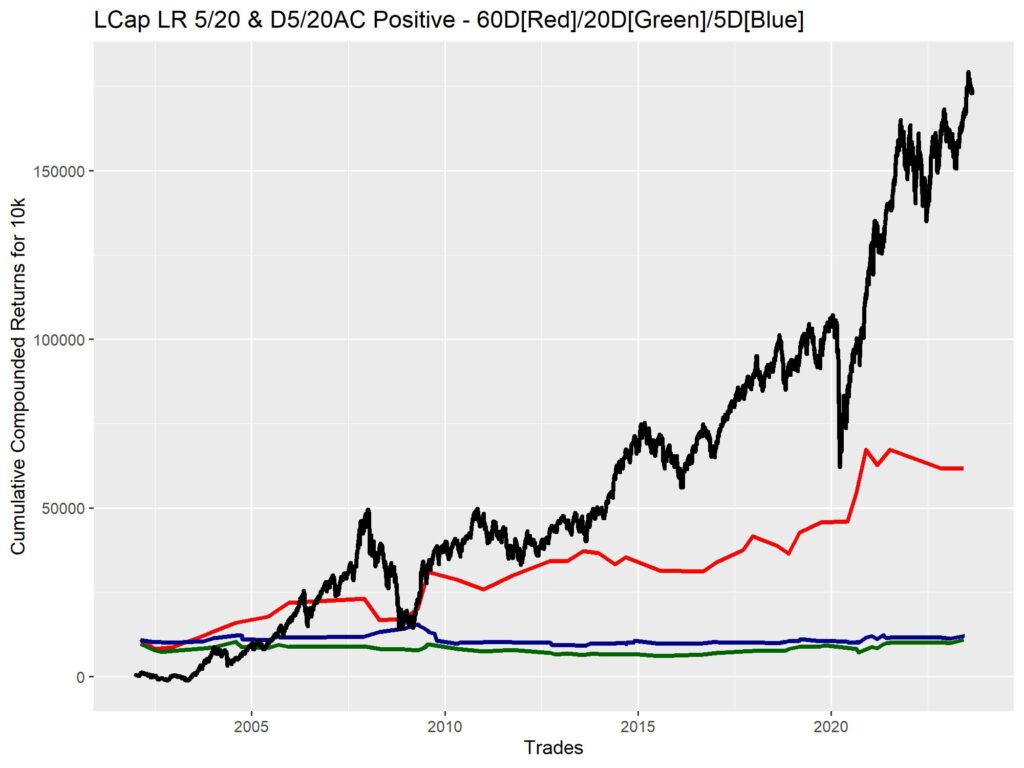
Black line is for NIFTY.
For sake of parsimony, I’m not inserting images for cumulative nominal returns equity curves (since the numbers in the tables already tell the story). They can be accessed HERE.
1. LR positive and significant for all windows (5/20/60D) and AC positive and significant for 5/20D windows

2. LR positive and significant for all windows (5/20/60D) and AC positive 5D window.
That flattish black line at the bottom, that’s the Nifty curve.
3. LR positive and significant for 5/20D windows and AC positive and significant for 5/20D windows.
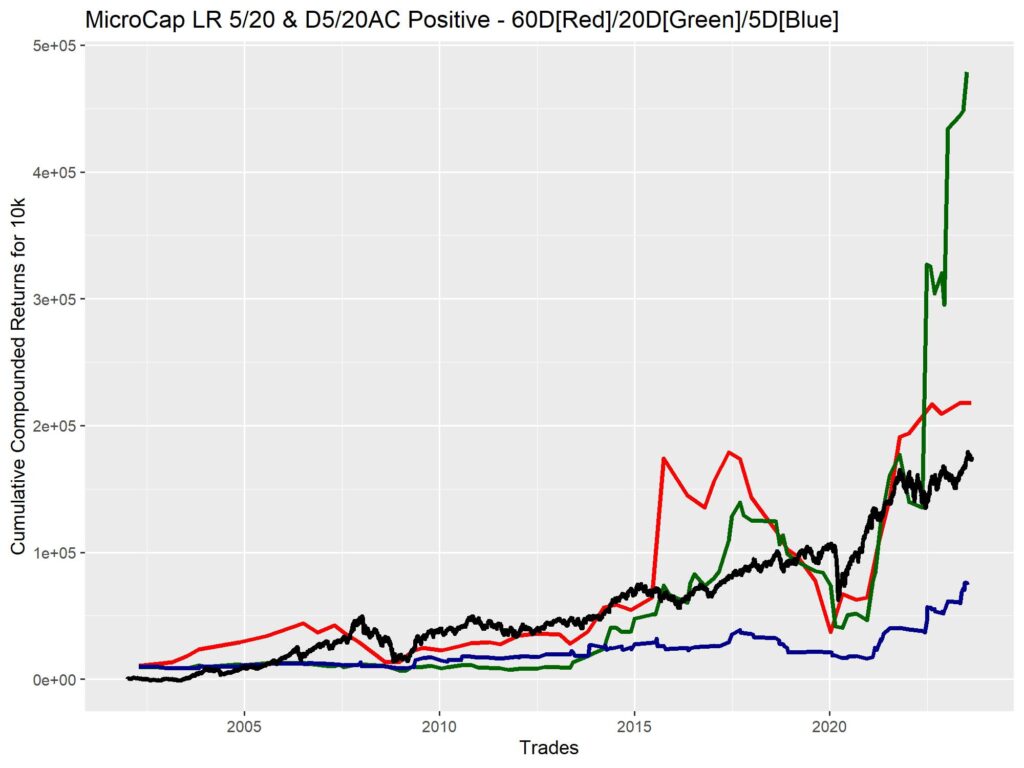
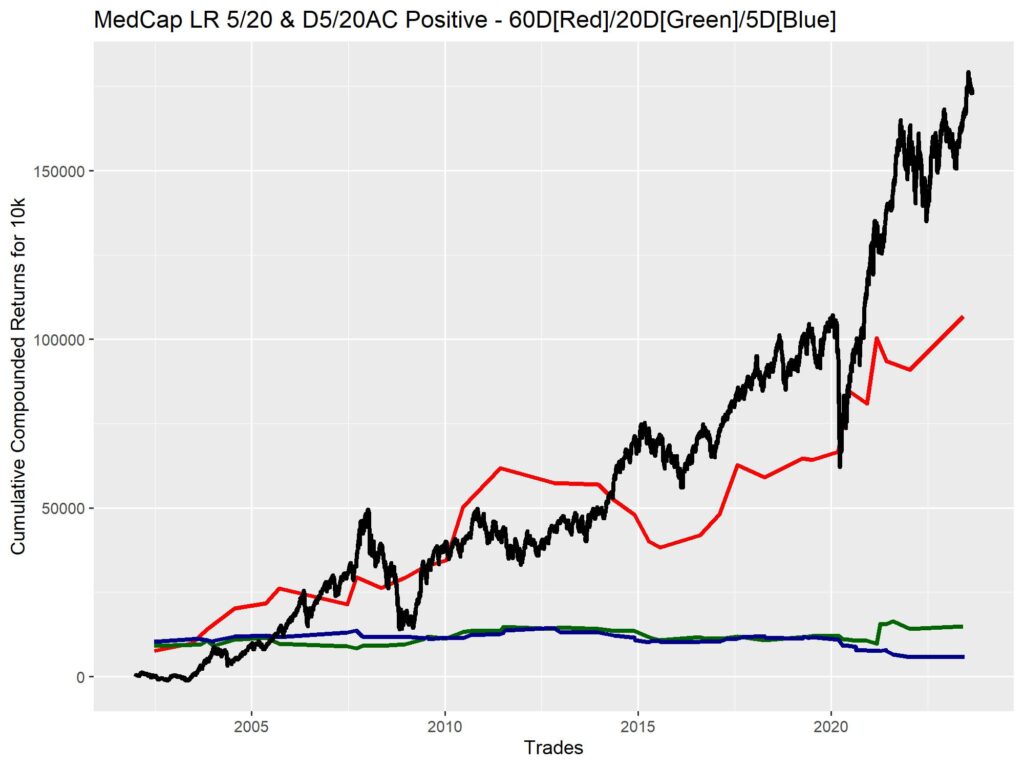
4. LR positive and significant for 5/20D windows and AC positive for 5D window.
DISCUSSION
Many of the compounded return curves, blow Nifty B&H out of its comfort zone.
However, as a word of caution, the return curves don’t really show a nice pattern with which to work with. For example, for some strats D20 gives good returns, while for others D5 or D60 do. Nor is it related to the stock universe (as will be apparent). Thus for getting a stronger conviction on the results, I’d definitely need to go for some sort of path testing, either bootstrap or Monte Carlo (I’d prefer bootstrap).
The most apparent pattern is that of lower number of accessible trades with signal criteria including D20 AC.
And longer holding periods will obviously reduce the number of accessible trades within the backtest, since we can’t buy until we let go of the previous position.
Overall, the D5AC and LR5/20/60 signal still seems the most favorable to me. With a good number of accessible trades, and producing stonking results at D60 (probably due to better quality of signal due to better confirmation of trend via LR60).
This backtest also cleans out out real world stock selection problems as well as transaction price problems which lead to bias, and provides more confidence in the results.
I hope this was useful. Watch out for the next one in the pipeline, for solidification of the results using path testing. Until then, Cheers.
Nice!
Pingback: Path analysis of Stock trends - Alpha Leaks
Pingback: Stock Trend Screener - Alpha Leaks