
Pinning the bounce screener stocks at the top. The backtest is below the currently screened stocks.
Large Cap Bounce Stocks
Mid Cap Bounce Stocks
Small Cap Bounce Stocks
INTRODUCTION
Most investors can classify themselves into either momentum investors or value investors. The preferred scheme of momentum investing is for those who like to buy things which are going up, and are likely to keep going up (given “X” narrative) – based on the “greater fool” theory. While those coming from a value investor framework, like to buy things that are cheap, and would rather wait for the market to start expressing their view of the particular stock. There definitely is a charm to this approach, after all who doesn’t like a good bargain with subsequent bragging rights.
After applying the “stonk to the moon” theory for making the stock trend screener (HERE), I decided to make a separate screener for those who like to buy things which are cheap (have fallen a great deal in the recent past) and are currently exhibiting signs of bouncing back.
First though, we need to validate that this indeed is a good way of investing.
PS. Those who have as yet not read about my AC and LR criteria, please get yourselves updated for context – HERE
METHODS
Initially I tried to experiment with the AC and LR criteria by checking various combinations of window lengths of each. But later realized that contrary to uptrends, bouncing back from downtrends is extremely messy. Meaning, getting a statistically significant autocorrelation (either negative – depicting change of trend, or positive – depicting continuation of trend) within any of the larger windows (20/60) is extremely difficult and leaves us with too few trades.
Then tried the smaller window autocorrelations (AC5), where I could not apply any tests of statistical significance as it wouldn’t be feasible due to the small number of samples within the window. The results were utter shit, with most of the trades crapping out (loss rate>50%).
Thus, I decided to scrap the AC criteria for the bounce and just focus in LR criteria.
The SIGNAL: 3 month downtrend (by significantly negative LR 60), followed by 1 month and 1 week uptrend (by significantly positive LR 5/20).
BACKTEST RESULTS
As before, with the stock trend screener backtest, I first did a single random path by –> random selection of stock from each marketcap universe –> on any given day, investing 10k –> follow up for a hold period of 5/20/60 days –> continue for the backtest period (2022-2023) –> compute cumulative nominal and compounded returns.
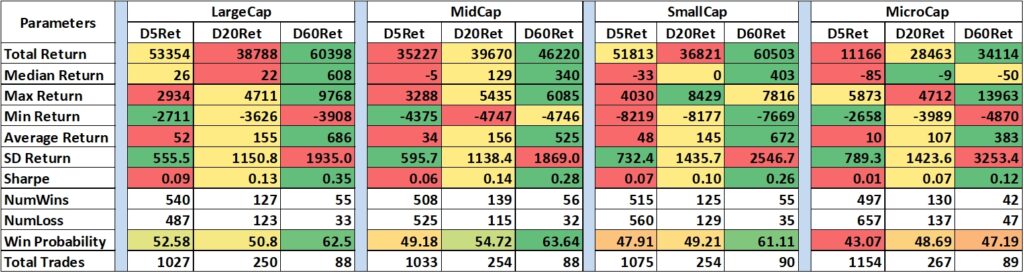
The Microcap space is particularly hideous with this strat (as seen in tables), hence eliminating the graphs for saving space.
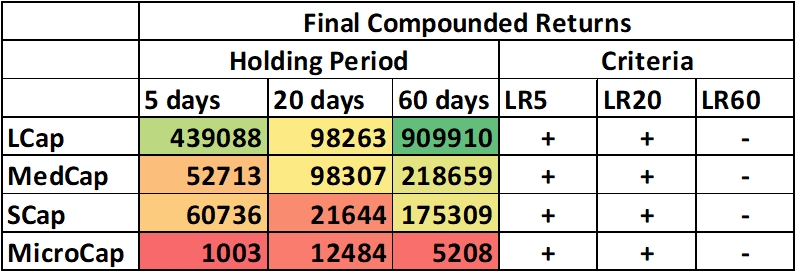
Presenting, first the nominal returns table, then the final compounded returns table, and finally the equity curves.
SINGLE RANDOM PATH – NOMINAL RETURNS SUMMARY
SINGLE RANDOM PATH – COMPOUNDED FINAL RETURNS SUMMARY
SINGLE RANDOM PATH – EQUITY CURVES (Nifty = Black)
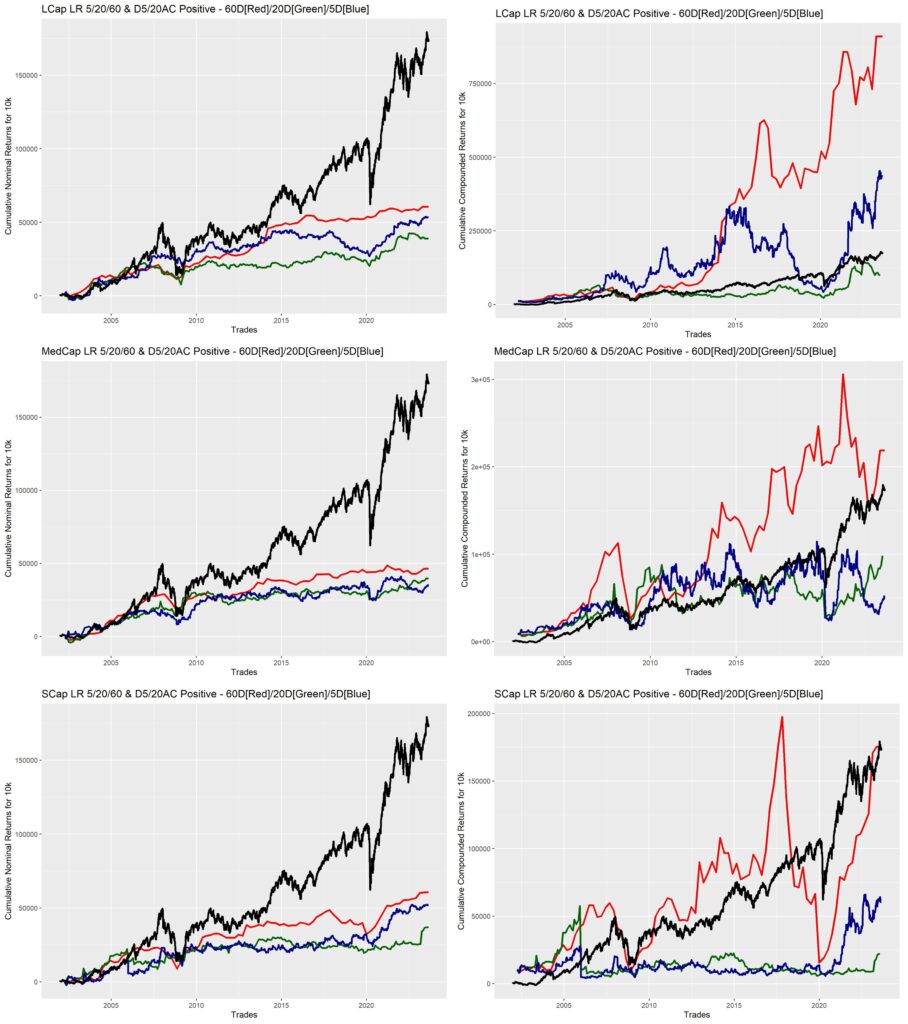
Looks like, it is worth investigating further after all. Compounded returns of some of the hold periods in some marketcap universes, is definitely above Nifty. Let’s go ahead with a Path Analysis. This was done using the same methods as detailed HERE.
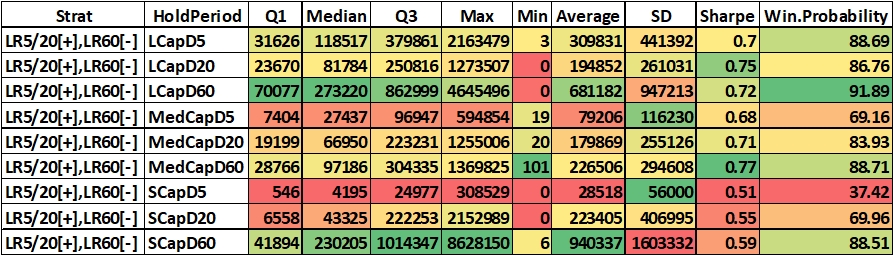
Below you’ll find the table summarizing the final returns from the simulated paths in each of the marketcap universes within each of the holding periods.
MULTIPLE RANDOM PATHS – COMPOUNDED FINAL RETURNS SUMMARY
MULTIPLE RANDOM PATHS – DRAWDOWNS SUMMARY
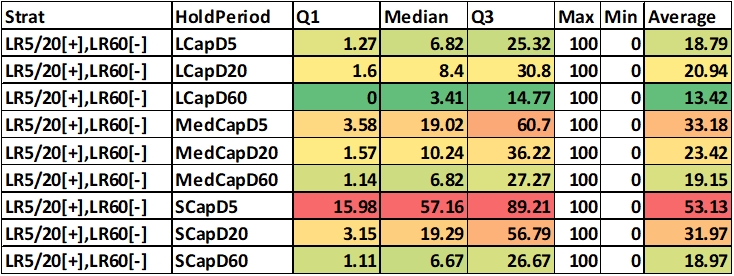
The above table depicts the percentage of path during which capital breached the initial invested amount of 10k. For example, in LCapD60, approximately 75% of the paths had a cumulative drawdown time of less that 14.8% of the total number of trades within each path.
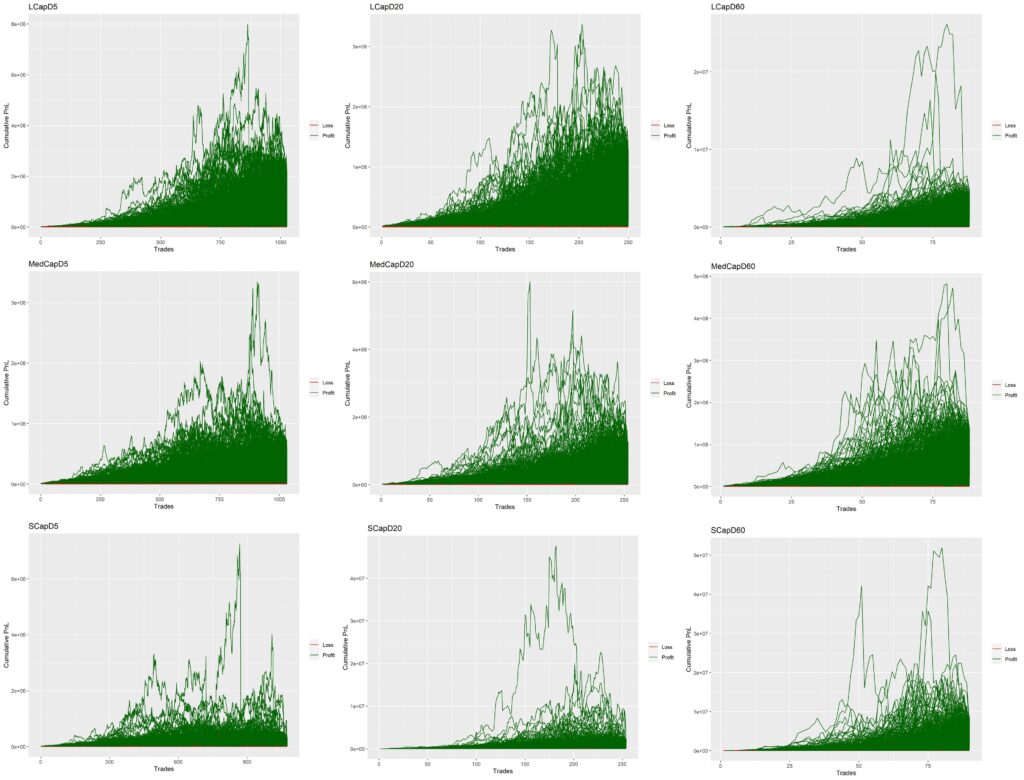
MULTIPLE RANDOM PATHS – EQUITY CURVES
DISCUSSION
Compared to the stock trend backtest, this one doesn’t show extra spectacular results, but still some of the strats have much better median results compared to Nifty (which has a final resulting PnL of Rs. 1,72,562).
The best by far were Large Caps and Small Caps with a holding period of 60 days (which likely resulted in smaller number of trades), which leads to the conclusion that the return per trade was pretty good in these. Surprisingly, small cap stocks outperformed mid cap stocks in this strat (unlike the stock trend screener). This likely points to the fact that high flying small caps exhibit quite a bit of profit booking towards the latter part of their run, but crashing small caps exhibiting return to uptrend, are regarded as “fallen angels”, and price increases purely from a value perspective (not FOMO) – this is of course, speculative reasoning on my end.
I have a sneaking suspicion that this strat will be far more valuable in timing buys of stocks that you want to own, but fear to buy due to their recent crash – from an accumulation perspective. But that is another backtest, for another time.
I hope this was a useful exercise.
If you want me to build a Stock Bounce Screener, Please comment on twitter (https://twitter.com/Dhritiman_Ch), or down below.
Until the next alpha leak, Cheers.