Once in a while, I take ideas from the Fintwit community and convert it into a strat, and if useful, into a screener. This article was spawned off an idea suggested by KalpaTrader, as an extension of the NSE methodology for selecting Momentum stocks.
The word “Kalpa” stands for “competent/proper/fitting” in Sanskrit. Since the results of this strat provide for much better returns than Nifty B&H, and in honor of the originator, I decided to name this method, “The Kalpa Strat”.
THE IDEA
The NSE methodology provides for equi-weighted score for 20/60 day momentum. That is, both 20 and 60 day momentum are considered equal. But thinking about it logically, is it really so?
Do returns 3 months back really count the same as 1 month returns?
Kalpa provided the idea that we calculate the momentum of four time periods (20/60/120/250) days and weight them based on exponentially reducing coefficients. Meaning the closest time period has the highest priority, and the farthest one, the lowest priority, with the priority reducing exponentially.
Based on these cumulative scores for each stock, we create a basket of top 20 stocks which get rebalanced every month.
THE METHODOLOGY
Data: Splits and Bonuses cleaned CM data, 2012: June 2023, of the current top 1k stocks by Market Cap.
Steps:
1. Calculate the past 20/60/120/250 day returns of each stock for each day.
2. Calculate the SD of stock returns for the past 250 days.
3. Calculate momentum by dividing each of the returns by the SD (momentum=risk weighted return).
4. Calculate the Z score of each of the above momentum scores for each day within the entirety of stock universe – Score of relative momentum for each stock.
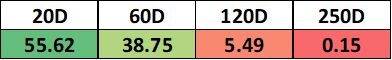
5. Multiply the 4 Momentum Z scores for each stock, with the exponential weighting coefficients (displayed below in the table) based on the window of returns(20/60/120/250), and add them up to get Duration Weighted Stock Momentum Score.
6. To test three different rebalance days of each month, select first, mid and last day of each trading month.
7. Select the top 20 Duration Weighted Stock Momentum scores from the list of stocks for each of the rebalancing days and compute one month forward returns of stocks and compute portfolio returns. The nominal returns have been calculated for Rs. 10000, distributed equally among the 20 selected stocks (5% portfolio weightage for each stock per rebalance).
PS. The returns have been computed from random price between high and low of the stock price for that day (both for buy and sell).
THE RESULTS
The intermediate data files can be downloaded HERE – Includes computed parameters data of all stocks for entire period, and TradeData of the difference Rebalance timings, individual stocks as well as summarized returns.
The results presented are of the actual path taken by the returns. Extra path analysis has not been conducted for the same, that’s for another time.
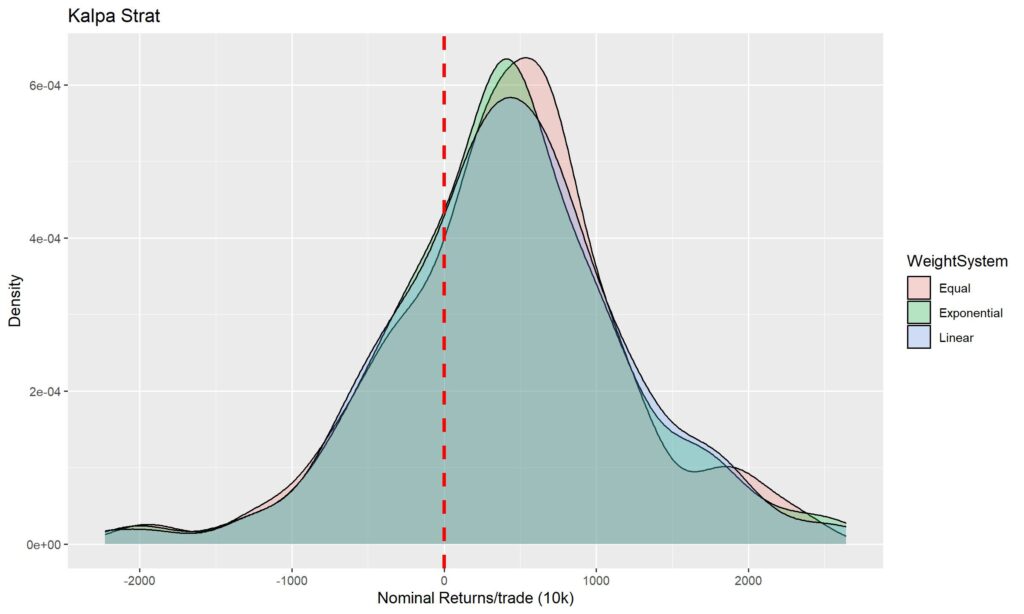
First let’s have a gander at the individual returns at each rebalancing for the difference rebalance timings (Day First, Day Last and Mid month). Below you’ll find a density chart of the same. If you do not understand the term “density” yet, please go through THIS ARTICLE.
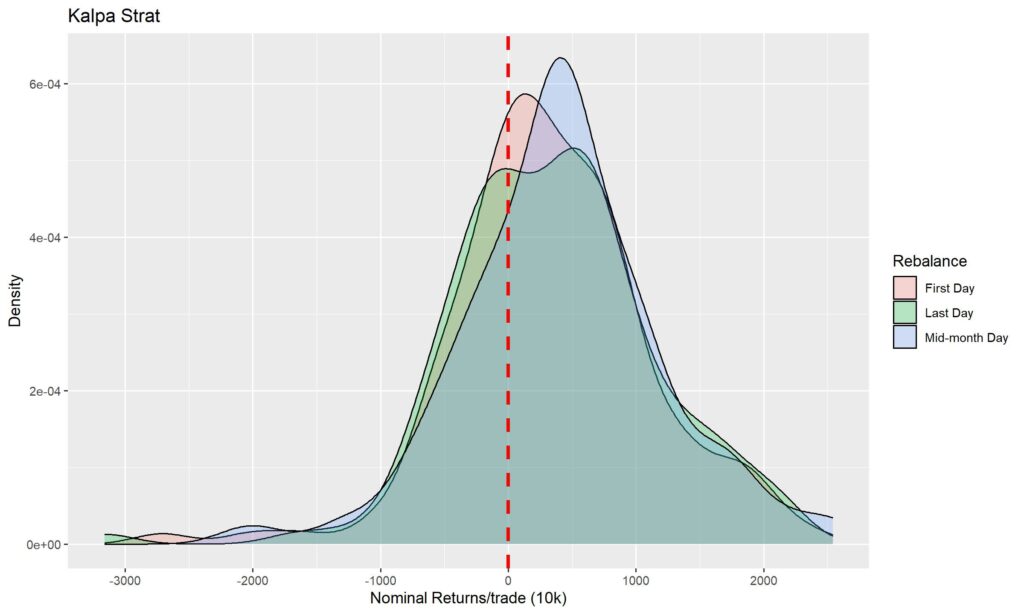
The red line denotes the zero returns for portfolio. Right off the bat, we can see how the Mid-month rebalancing is skewed left. Thus we see that Mid-month rebalancing provides superior returns than first or last day of the month, with a higher probability of positive returns. The numerical summary of the same can be observed below:

The returns used here are cumulative nominal returns of portfolio for 10000 per trade (or 500 Rs. per stock). We again see that Mid-month rebalance leads to a higher win probability, lesser drawdown, higher max and median returns, and higher Sharpe ratio.
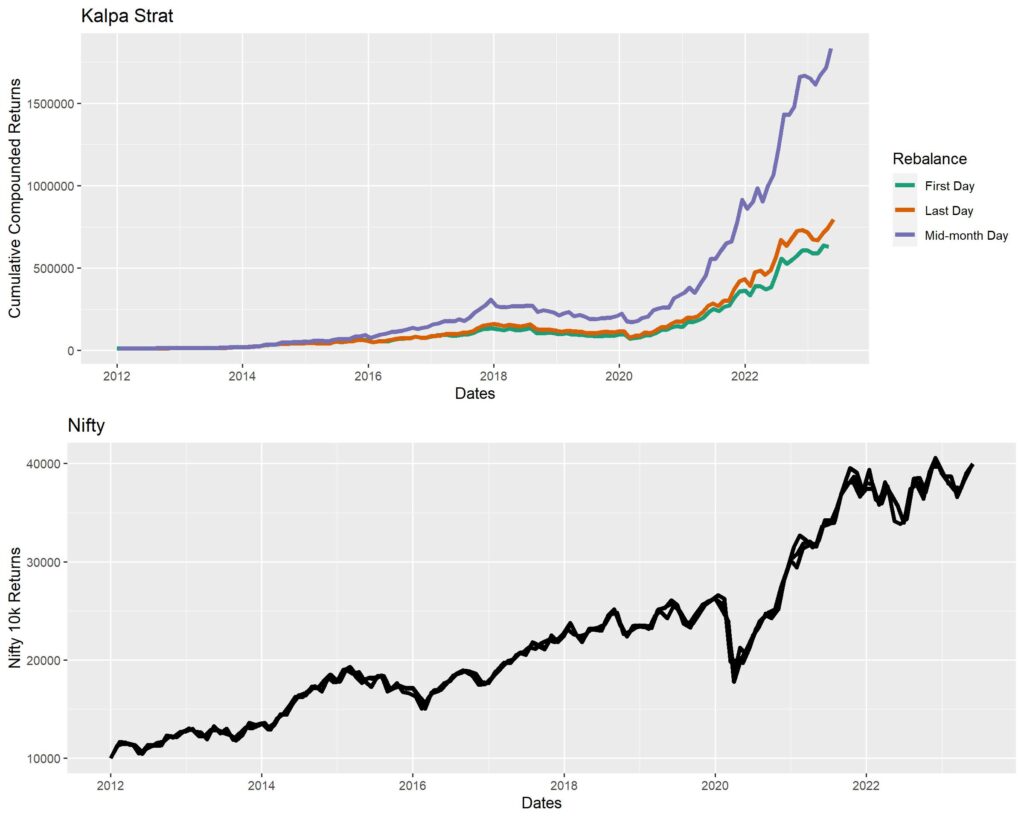
How does it fare against Nifty though? Suppose we had put 10k into Nifty at the beginning of 2012 (the backtest period). That’s have netted us slightly less that Rs. 40,000 by the end of the backtest period.
The compounded returns from this strat though, blow Nifty out of the bathwater.
The final compounded returns for a starting capital of Rs. 10,000 for the Kalpa Strat are:
1. First Day Rebalance: Rs. 6,29,010
2. Mid Month Rebalance: Rs. 18,32,778
3. Last Day Rebalance: Rs. 7,96,763
Below you’ll find the comparative Equity curves for the same.
DISCUSSION & LIMITATIONS
The considerations pointed out in the stock trend screener backtest (HERE), hold true here also. There is definitely some selection bias (due to difficulty of cleaning Splits and Bonus, I’ve restricted to the top 1k stocks currently trading). To put into perspective, only about 500 of the top 1k stocks currently trading were trading back in 2012. But, since we are not aiming for buy and hold, I guess some of the risk is reduced due to optimistic selection.
Adverse selection can definitely happen if a trending stock starts hitting lower circuits subsequent to purchase. But portfolio risk is significantly mitigated by buying a basket of 20 stocks (5% capital in each stock).
Another consideration is that for expensive stocks (per share nominal cost). Since we are doing theoretical percentage based returns, we can use 10k with Rs. 500 in each stock for testing. In real life the capital required will be much more, to incorporate the minimum 5% allocation for the most expensive stock getting selected. Those details, I cannot really account for and will have to be worked out on the fly. To put this into perspective, understand that 90% of stock prices are below Rs.1600, and for allocation to one such stock in this portfolio would need at least Rs. 32,000 capital for each rebalance.
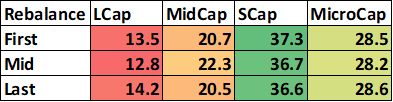
Lastly, since we did not account for the stock universe during the selection, most of the selections happened to be from the Smallcap and Microcap universe. This is expected since the sharpest returns are observed from those stock universes. Below is the percentage table of universe of stock selection.
CONCLUSION
I hope this was useful for the readers. I will likely make a screener for the Kalpa Strat in the future (will be useful for Small and Microcap selection). My guess is, this will pair nicely with the AC/LR based stock trend screener for Large and MidCap universes (HERE). If a separate screener for all the stock universes is required, please comment below or get in touch with me on twitter @dhritiman_ch. Thank you for reading. Cheers.
Special thanks to KalpaTrader for the idea.
ADDENDUM
As suggested by @KalpaTrader on twitter, added two more weighting mechanisms:
1. Linear: Weights for 20/60/120/250 are 0.4/0.3/0.2/0.1 (linear reduction in priority over time).
2. Equal: Weights for 20/60/120/250 are 0.25/0.25/0.25/0.25 (all durations have equal priority).
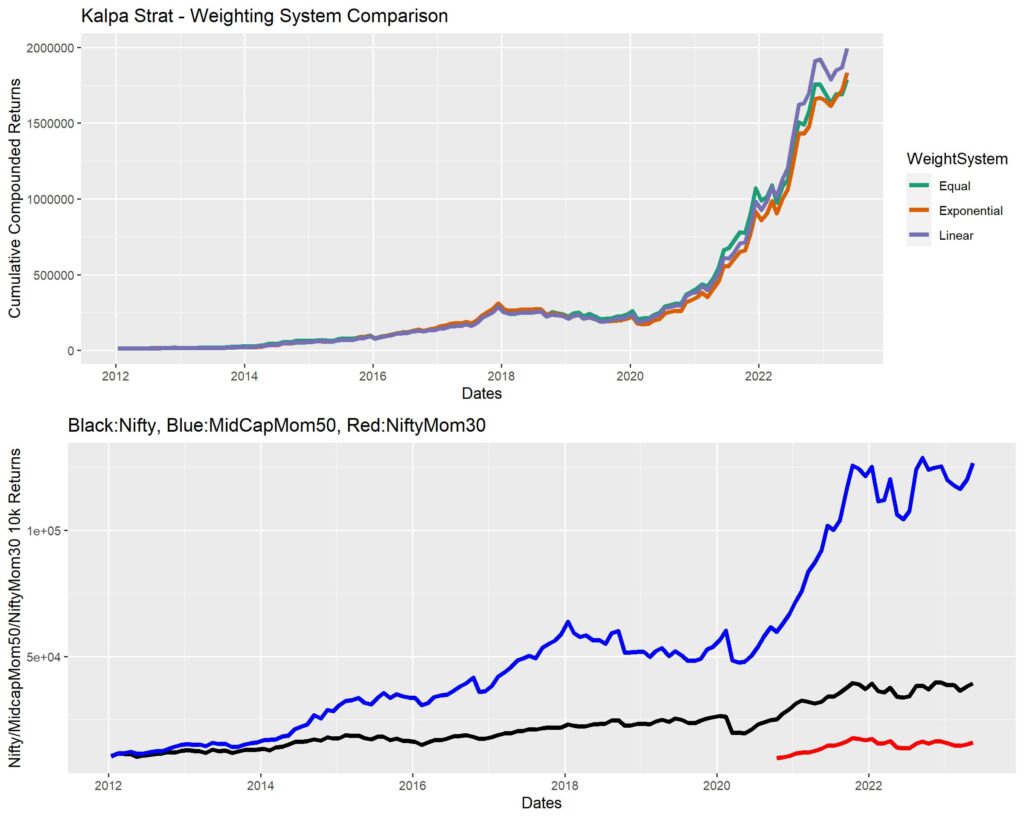
Another addition is comparison graph including Nifty Momentum 30 (unfortunately no data available from NiftyIndices before Oct 2020) and Nifty Midcap Momentum 50.
Returns for the included indices (for 10k) are:
1. Nifty: ~40,000
2. Nifty Momentum 30: ~16,000 (artefactual due to no available data)
3. Nifty Midcap Momentum 50: ~ 1,26,000
Results are calculated only for Mid Month Rebalancing (since that was the best time earlier).
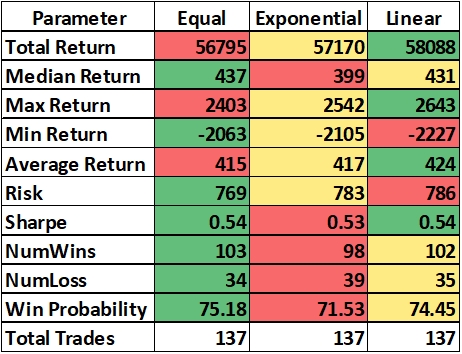
Cumulative Nominal Returns Summary Table for all Weighting Systems
Nominal Returns Density Graph for all Weighting Systems
Equity curves for all weighting systems compared to Indices
The final returns for the three weighting systems are as follows:
1. Exponential: 18,32,778
2. Equal: 17,88,862
3. Linear: 19,93,338
Discussion: As we can see, linear weighting system seems to be the better choice by a very small margin. The difference between the three are frankly quite negligible, but seeing that Linear weighting is simple and intuitive, as well as provides slightly better returns, I would go for linear weighting in the future.
The differences from all the Nifty Indices is frankly not worth talking about. This method wins by a large margin (even if we include transaction charges and taxes on short term gains).
Cheers.
Hi,
Results for mid month look interesting.
Just a couple of thoughts
1)Including 120 and 250d worth the complication and effort? Weights seem too low to make any significant impact
2) is there a simple way of changing the universe at every re balance? Somehow the comparison against Nifty doesn’t feel right
Thanks for putting this together
Adding comparison against Nifty Momentum 30 as well as Midcap Momentum 30, as well as showing the effect of other weighting systems as an addendum to the article.
Hello Dhritiman,
Results for mid month look interesting.
Just a couple of thoughts
1)Including 120 and 250d worth the complication and effort? Weights seem too low to make any significant impact
2) is there a simple way of changing the universe at every re balance? Somehow the comparison against Nifty doesn’t feel right
Thanks for putting this together
It would be interesting to see results if we will do rebalance on weekly basis instead of monthly balance.
Will it be possible to publish the results with weekly rebalance ?? It might increase transaction cost but may help to reduce drawdown .
Easily possible. But frankly, these strats fall flat due to transaction costs. With a basket, the txn costs as a percentage of the profits gets really high, and it becomes worthless if you consider taxes. Weekly might be profitable, but won’t be worth it.
Hi guru,
It was great insight , request you to build a scanner for different universe of stocks .
thank you,
regards
Abhilash
Will do Abhilash. Right now going through a tough time in personal life. Taking a break from everything for a while. Will make new content after New Year. Need some peace till then. Will continue updating the website though.