Summary: The best results in all cases of dojis is to go long for next day gap up when there’s a doji in an uptrend.
The basis of many technical analysis signals is the shape of the candle stick. It always fascinated me that the candlestick patterns might hold some intuitive logic to them, for being so popular.
So, I begin a series of back-testing popular candle stick patterns. The first to fall victim to my testing is the common Doji candle. The analysis will be done on Nifty spot values over the last decade.
Visually, Dojis are easy to make out. But quantitatively, they’re quite imprecise.
I focused on the following attributes:
1. The absolute Open to Close distance is less that 20% of the High Low distance.
2. AND both the wicks (upper and lower) are larger than the candle body.
Using these I plotted out the reversal candles on the Nifty chart from 2012 to current. The following image shows the same.

However, Dojis aren’t really useful if they happen randomly. They’re considered more useful at the end of an up or a down trend to indicated reversal. In that sense I used my autocorr and linreg indicator pair to determine an up or a down trend at the date of the doji. Then I summarized the results for next day Gap. The results are below.
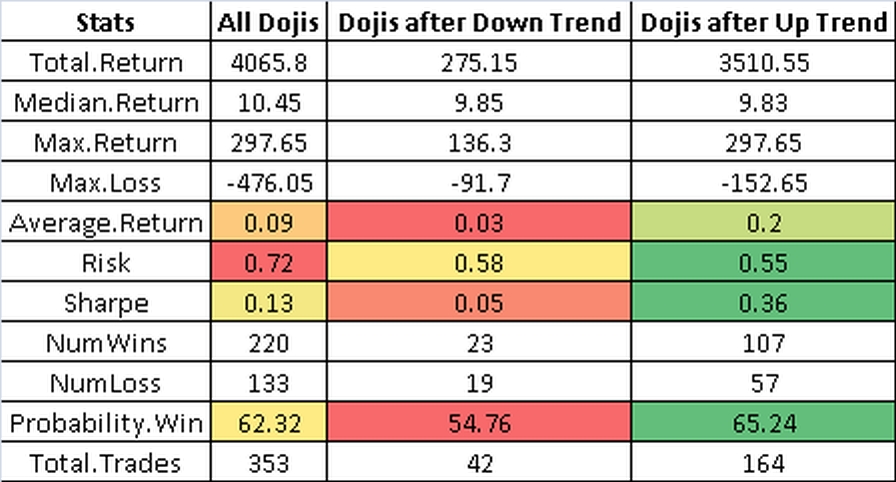
These show a higher win rate for going long after a doji is formed during an uptrend. Hence, it doesn’t really show a reversal. If anything it shows that in all circumstances (any doji, but specifically during an uptrend), going long works out better.
Next I conducted the same analysis for close to close returns for D1 and D5 after the doji. The results are summarized in the figure below. The results are indeterminate with around 52-57% win probability of going long.
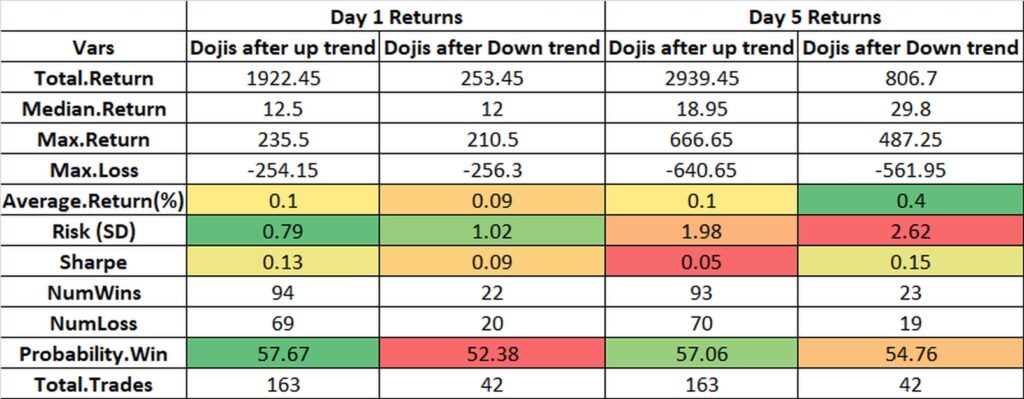
Conclusion: The best results in all cases of dojis is to go long for next day gap up when there’s a doji in an uptrend.
This type of post doesn’t really contain an Alpha Leak. But they do help clear up some concepts quantitatively.