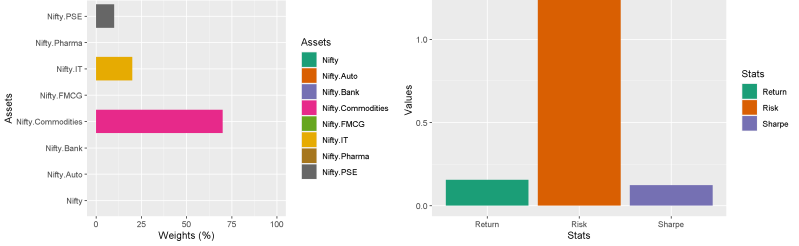
Just to illustrate how the optimal portfolio can change over time, here is a video illustrating the changes in a portfolio of Nifty sectors from 2012 to 2022. With a look back period of 20 days. More interestingly, during the March 2020 crash, the optimal portfolio was 100% in Pharma even at the beginning of the crash.
Now compare that with the a Mean Var portfolio with a look back period of 1 year (250 days). Looks far less twitchy, though with a lower Sharpe most of the time. Also, it picks up on changes slower. Need to do a lot more testing to find the optimal lookback period. But for now, enjoy…
This is more of viewing for pleasure rather than for Alpha Leak.
For viewing the live MV portfolio (20 days lookback) click HERE.