Since the idea of mean variance optimization sounded so quanty, I have been obsessed with it. Finally, got around to backtesting it. Quite a painful procedure compared to most that I have done previously.
The results were equally painful. Read on to know.
Rules of backtest:
1. Data: Indices data from 2012-current. Included Indices are: Nifty, Nifty PSE, Nifty Pharma, Nifty Auto, Nifty Bank, Nifty FMCG, Nifty Commodities & Nifty IT.
2. Look back period for obtaining mean variance weights: 20 trading days.
3. Return period: 20 trading days
4. Method: Invest 100000 every 20 days according to weights in each index obtained for the past 20 days and get returns for the future 20 days.
5. Benchmark: Compared to Nifty investment in the same methodology to get comparable return dates.
Below you’ll see the graphical return profile of both the methods:

Below you’ll find the statistics for the returns:
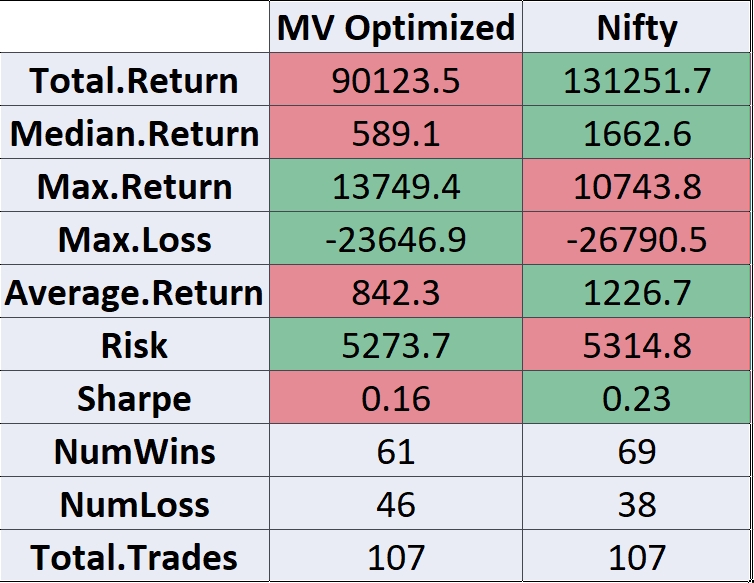
As is visible in the above numbers and graph, the backtested returns are quite shitty. Adding insult to the injury is that just buying and holding Nifty over that entire period would have led to even more superior returns.
Conclusion: There is just no beating Buying and Holding Nifty by any sort of mean variance portfolio optimization procedure. Reason is likely because, past returns are not indicative of future returns.
Here you’ll find the method in the way the analysis was done. Only those who wish to learn how to use R to backtest should go through this, else you’ll find it quite boring.
As promised in the youtube video, here are the syntax and intermediate files for your coding pleasure.