Trends in markets are a brilliant phenomenon. Its simple to observe, compute, and act on, and it just works. Something going up, will keep going up. But the simplicity hides quite a few intricacies.
1. How much up is good enough to be called up?
2. Is the up accompanied by heart attack inducing downs once in a while?
3. How much will it go further up?
4. Till when will it stay up?
…and maybe a few more.
INTRODUCTION
I’ve expounded before on the AC and LR criteria before – HERE, and used it as a criteria for BTST/STBT in Nifty (HERE).
In brief, Autocorrelation (AC) coefficient tells you clean/messy a trend is. A clean trend will be AC+ and messy will be AC- (answer to intricacy 2)
Linear regression (LR) coefficient gives you the direction of trend. It is a bit computationally intensive. Can easily use average returns over the window instead of this (much cheaper computationally, for giant data sets with running windows).
However, just the sign of the AC/LR may not be enough. Since both are continuous numbers, they won’t be exactly 0 most of the time. So how do you know if the AC and LR are good enough to act on? This is where statistical testing comes into play (to know more, read HERE). I consider the the AC and LR values useful, when they have less that 5% chance of being a random chance event (read about 95% confidence levels from anywhere) – (answer to intricacy 1)
Even with this, there are a few things to figure out – the window length for AC/LR calculation, and the lag for the AC.
The intuitive window lengths are 1 week (5 days), 1 month (20 days) and 1 quarter (60 days). The lag for AC is a bit of a conundrum, and there are no guidelines for it. Basically, it required a bit of f*cking around and finding out for me. Settled on 2, 5, and 10 day lag for 5, 20 and 60 day windows. The smaller the lag, lesser the confidence you have in the value being representative of trend, but larger the lag, more chances you miss out on the trend (late signal). The lags I used found sort of a sweet spot.
The last two intricacies, are unknowable. But using a time target for exit (5/20/60 days) and working on a large sample of data helps get around intricacy 4 and 3, respectively. Now let’s describe the backtest.
METHODOLOGY
Data: NSE EOD CM Bhavcopy data.
Duration: 2000 Jan to present (20 years)
Methodology:
1. Compile and clean the bhavcopy CM data for bonus/splits (massive task – no easy way unfortunately).
2. To get around the ticker name change conundrum, I used current top 1000 stocks, selected out from the past data based on current ticker symbol (remember, it is a backtest, not a history log – don’t be pedantic).
3. Compute the criteria for selection – D5/20/60 AC and LR – use only the statistically significant ones (for 20/60D windows), discard rest.
4. Compute returns for D5/20/60 days and test out various combinations of AC and LR for their respective cumulative returns.
Links to relevant data sets generated and used:
1. Entire CM Data 1995-2023 (.RData format – else it is just too big)
2. Splits and Bonus Data (2000-2023)
3. CM Data (top 1k, 2000-2023) after adjusting for splits and bonuses (.RData format – else it is just too big)
4. Trend Criteria and Returns (log) computed CM Data (top 1k, 2000-2023) (there are other criteria computed too, for future backtests).
4a. Large Caps (top 100)
4b. MidCaps (next 150)
4c. SmallCaps (next 250)
4d. Microcaps (next 500)
5. Trade data of backtests conducted under conditions given below. (.csv files – these are small)
The tests were done in 4 conditions:
1. LR positive and significant for all windows (5/20/60D) and AC positive and significant for 5/20D windows.
2. LR positive and significant for all windows (5/20/60D) and AC positive 5D window.
3. LR positive and significant for 5/20D windows and AC positive and significant for 5/20D windows.
4. LR positive and significant for 5/20D windows and AC positive for 5D window.
PS.
1. The AC significance is a bit stringent. Using AC+ and sig for all three windows gets very few trades – hence only 5/20 used.
2. 5D AC and LR values were not subjected to significance testing because the sample size was too small (5 values) and the computed standard errors too large for getting anything significant.
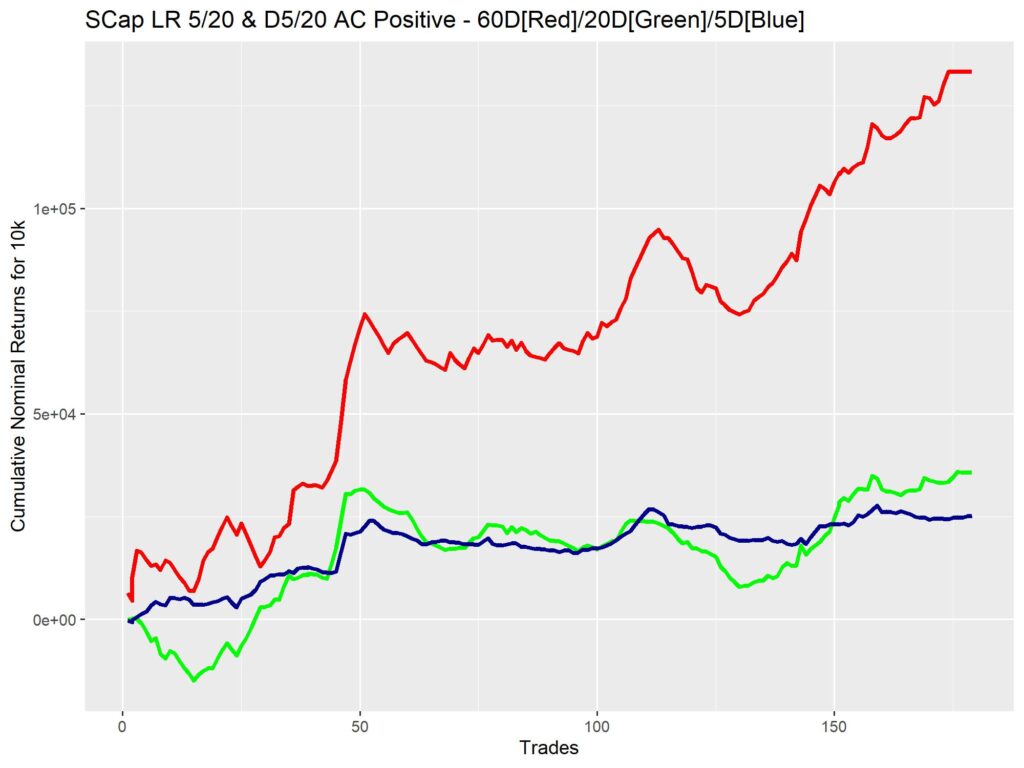
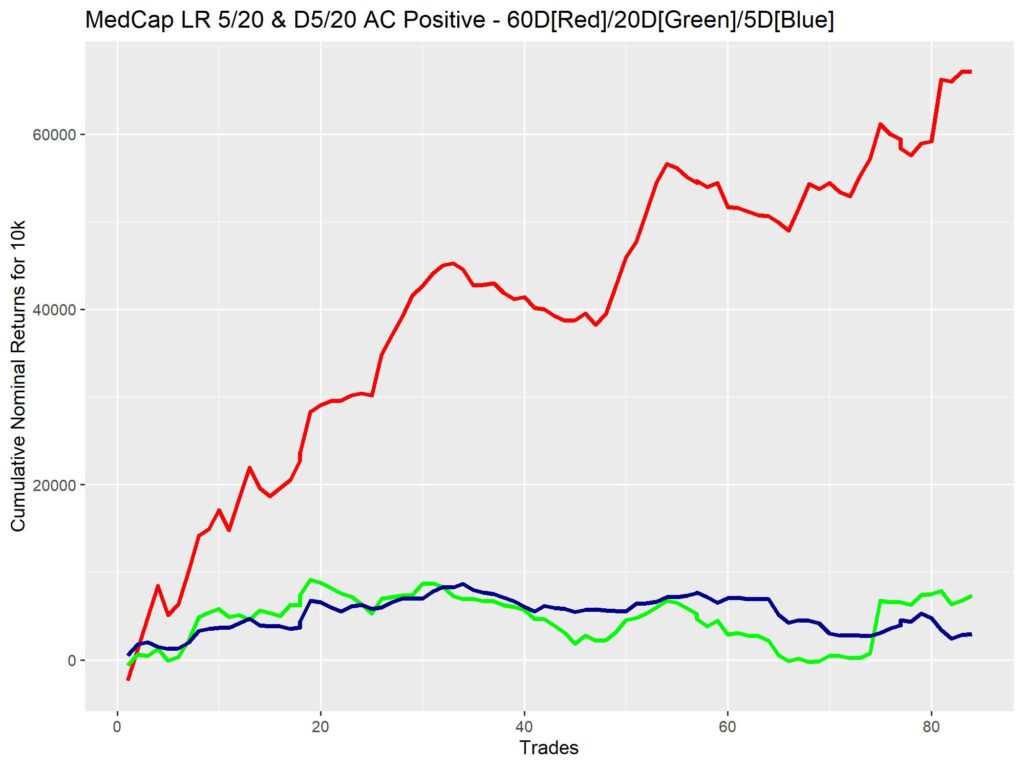
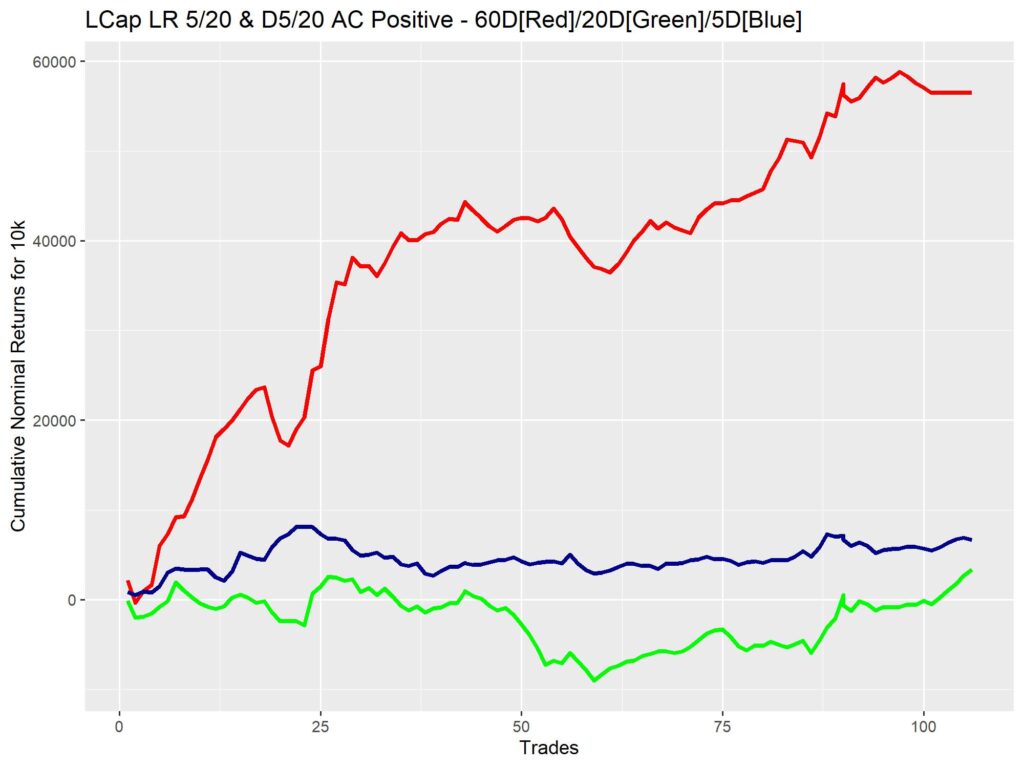
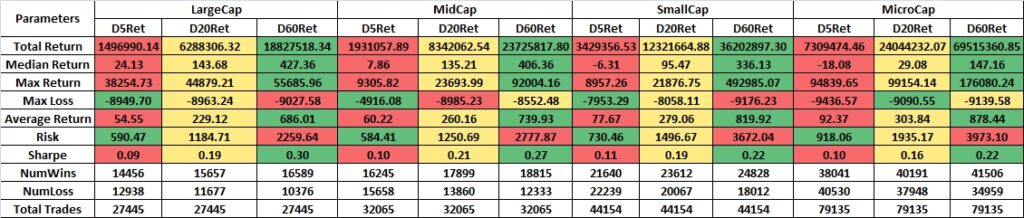
3. The returns are computed for 10k investment per trade, as logs, summed and inverse logged.
RESULTS
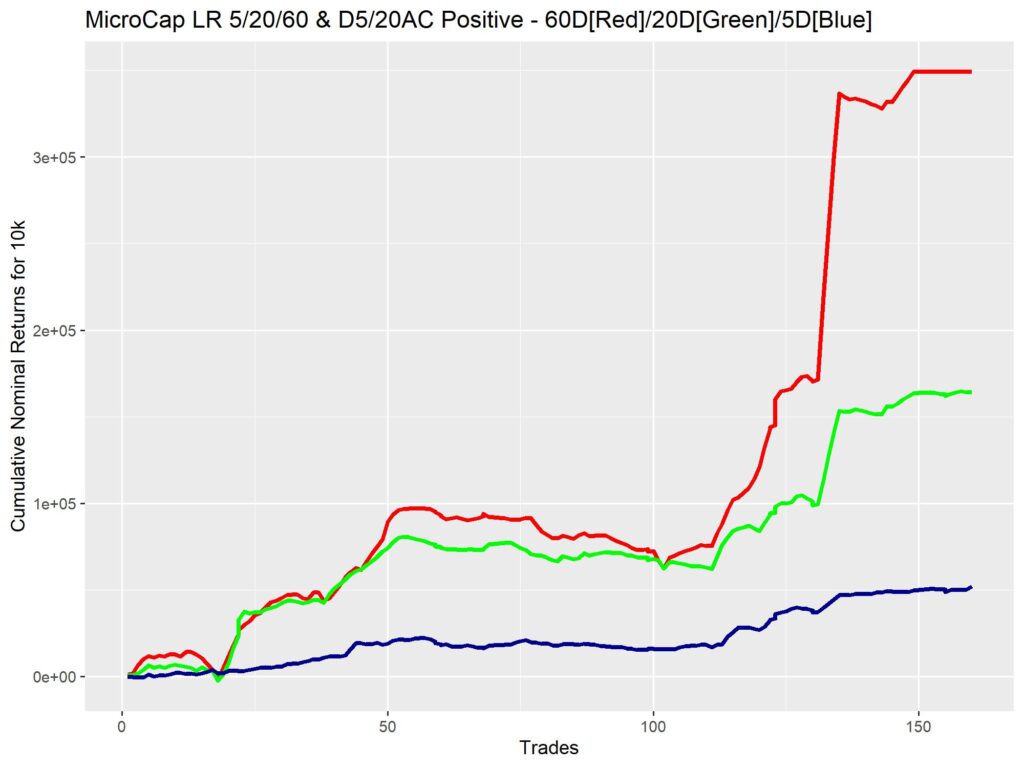
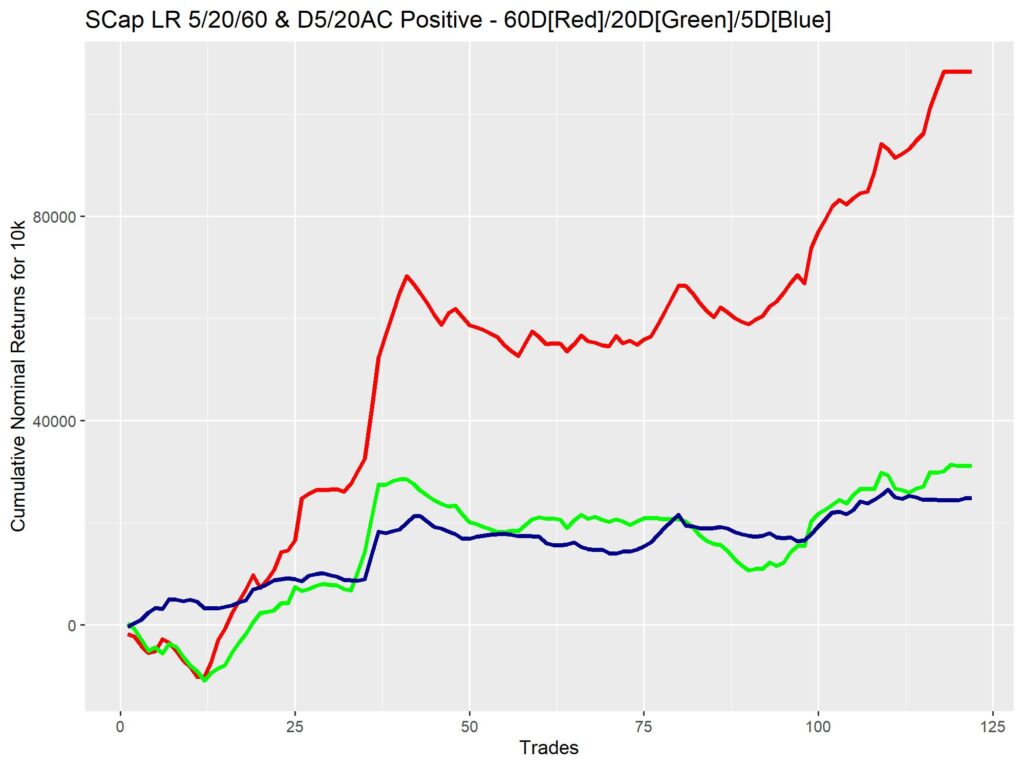
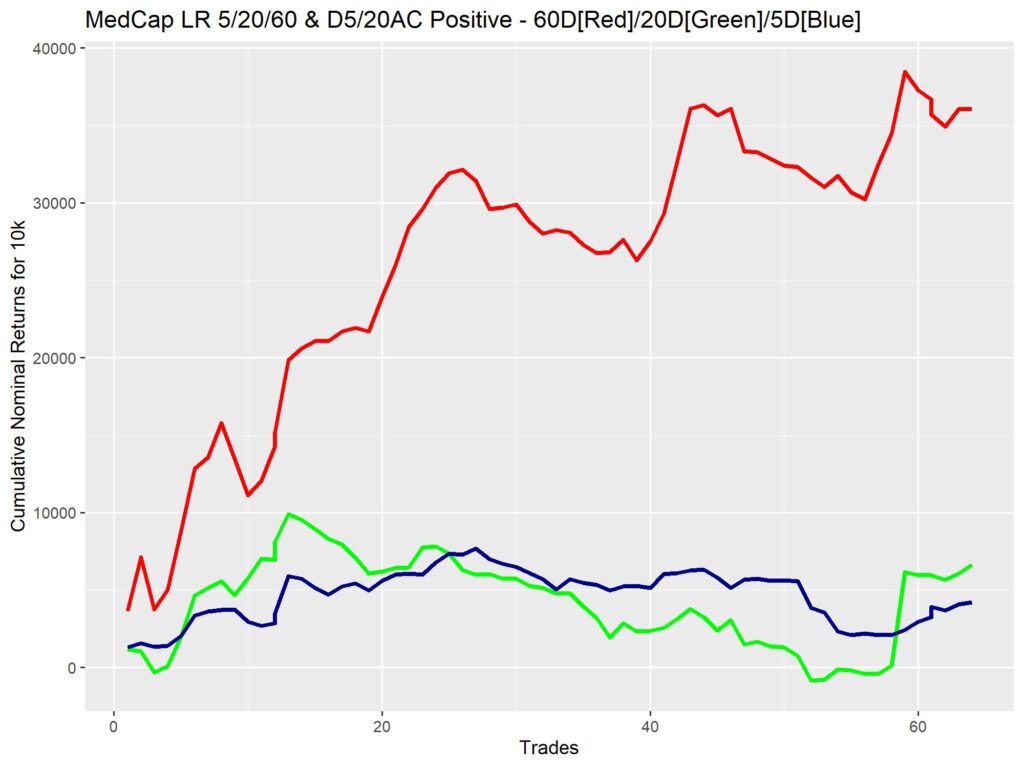
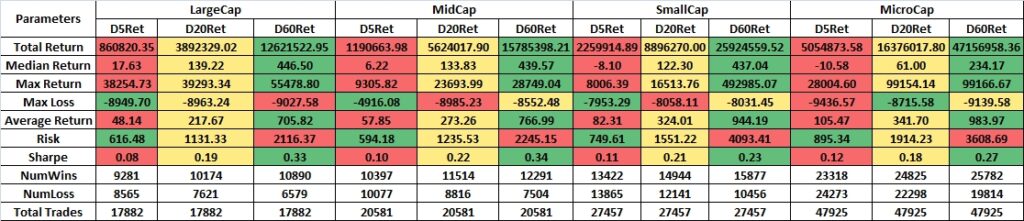
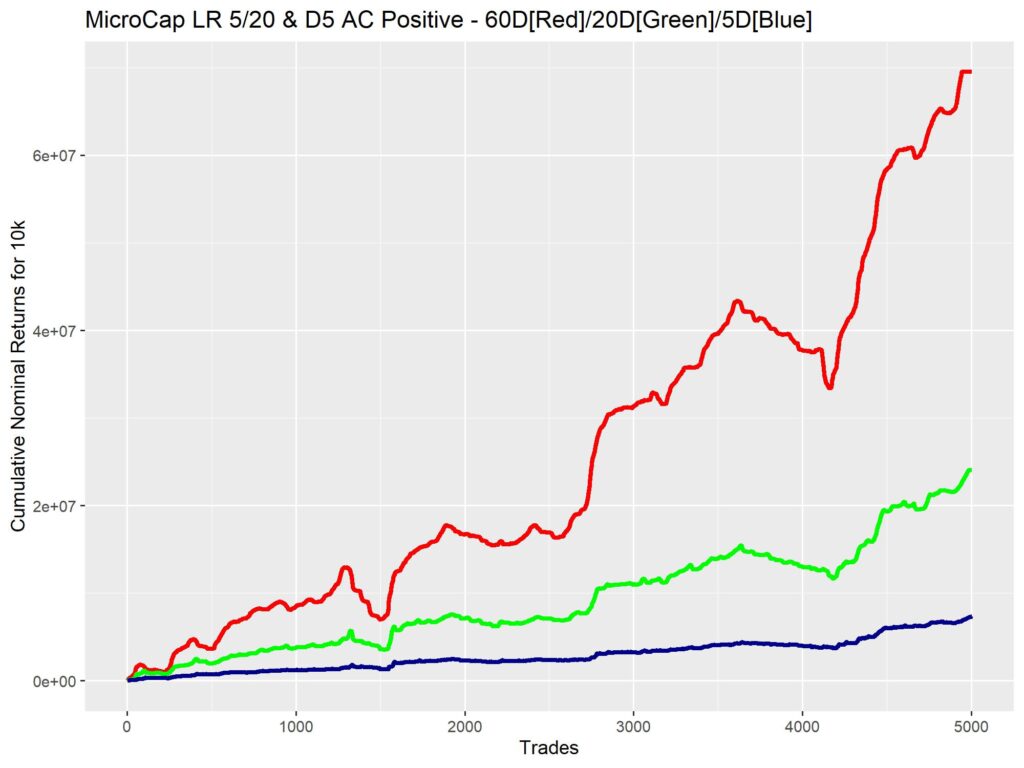
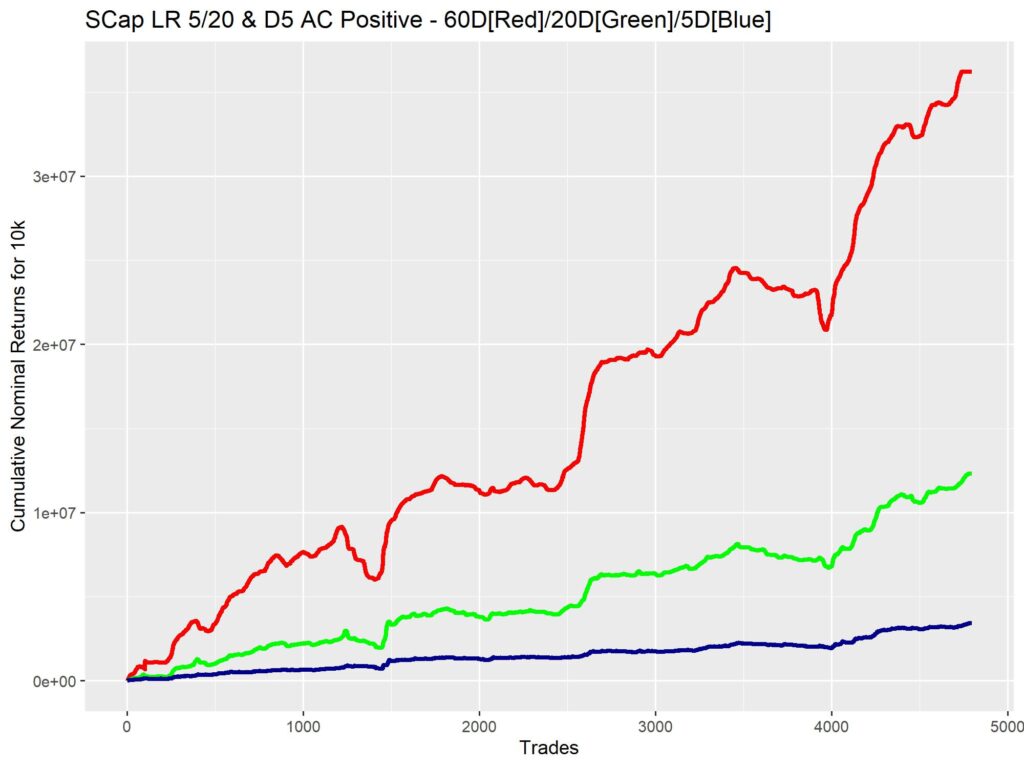
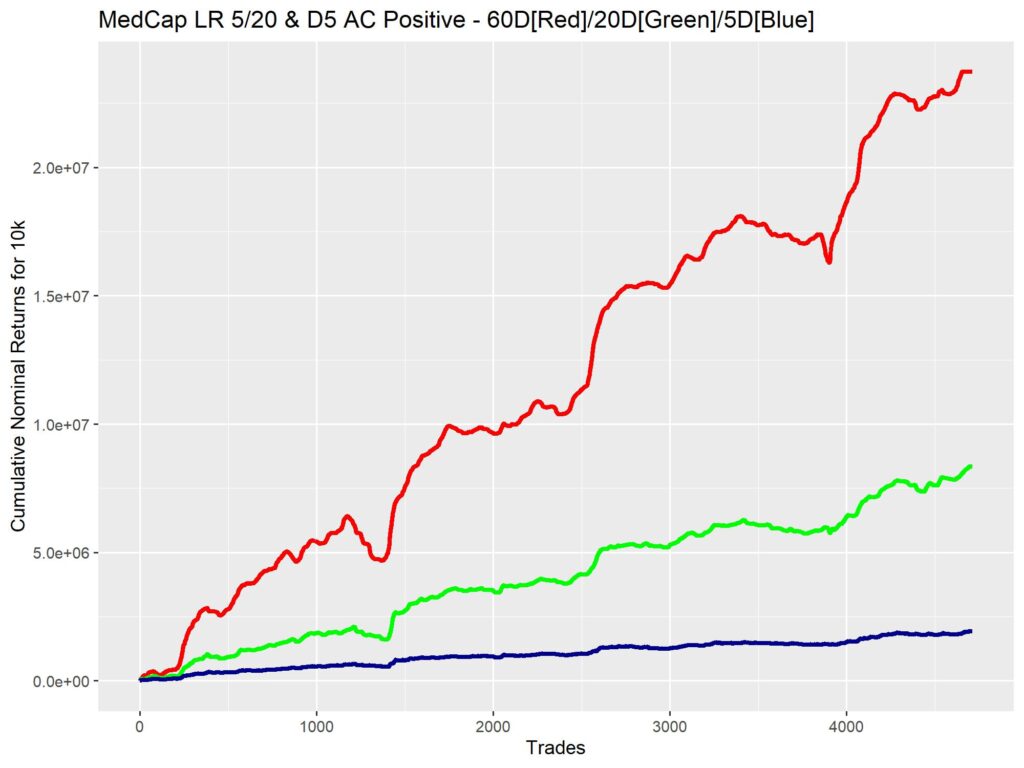
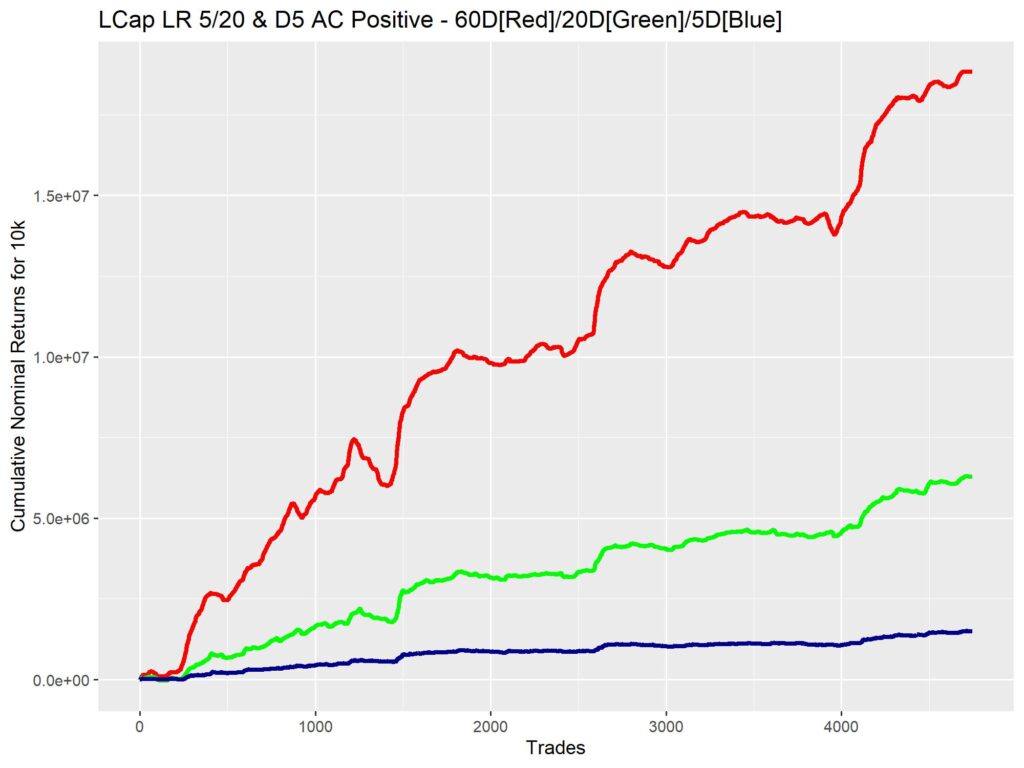
I’ll let the tables and figures speak for themselves here.
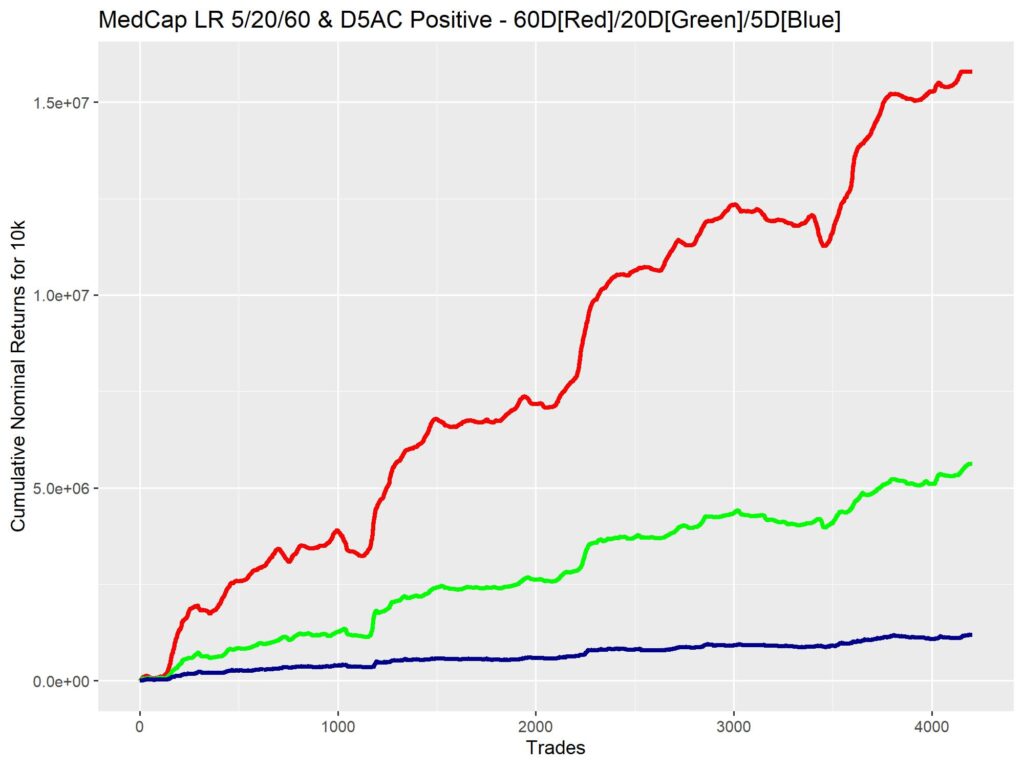
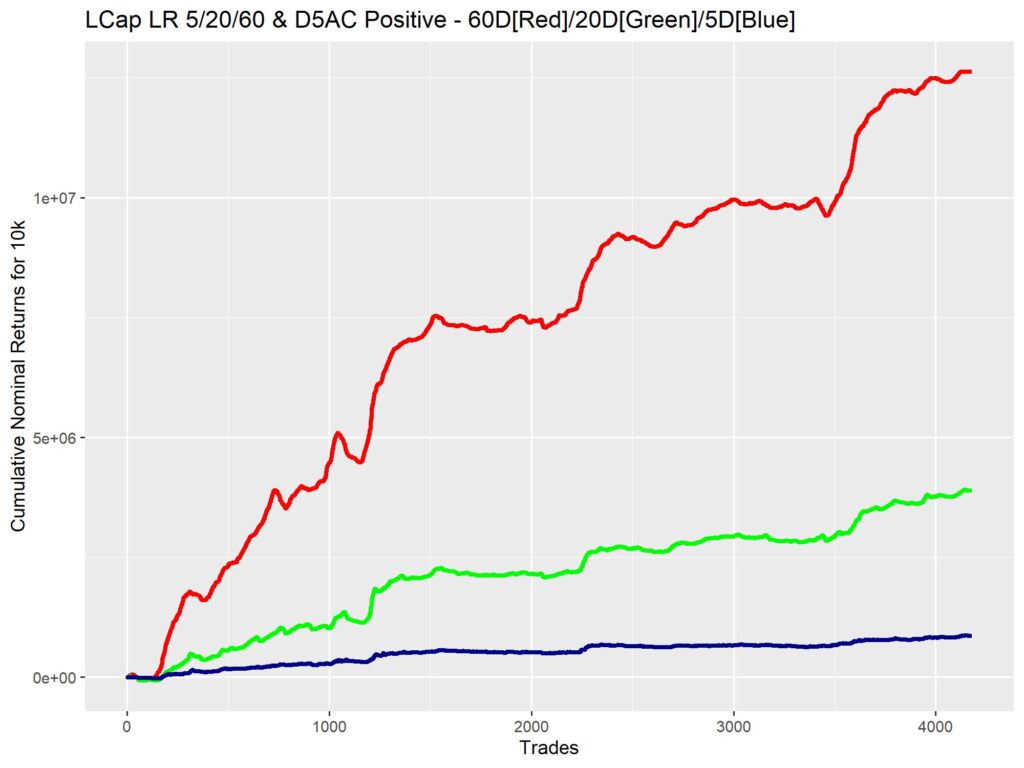
1. LR positive and significant for all windows (5/20/60D) and AC positive and significant for 5/20D windows.
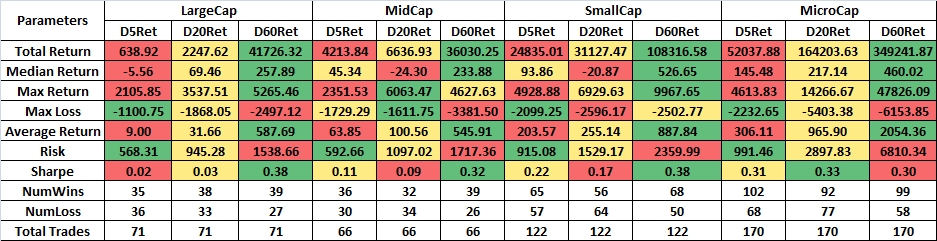
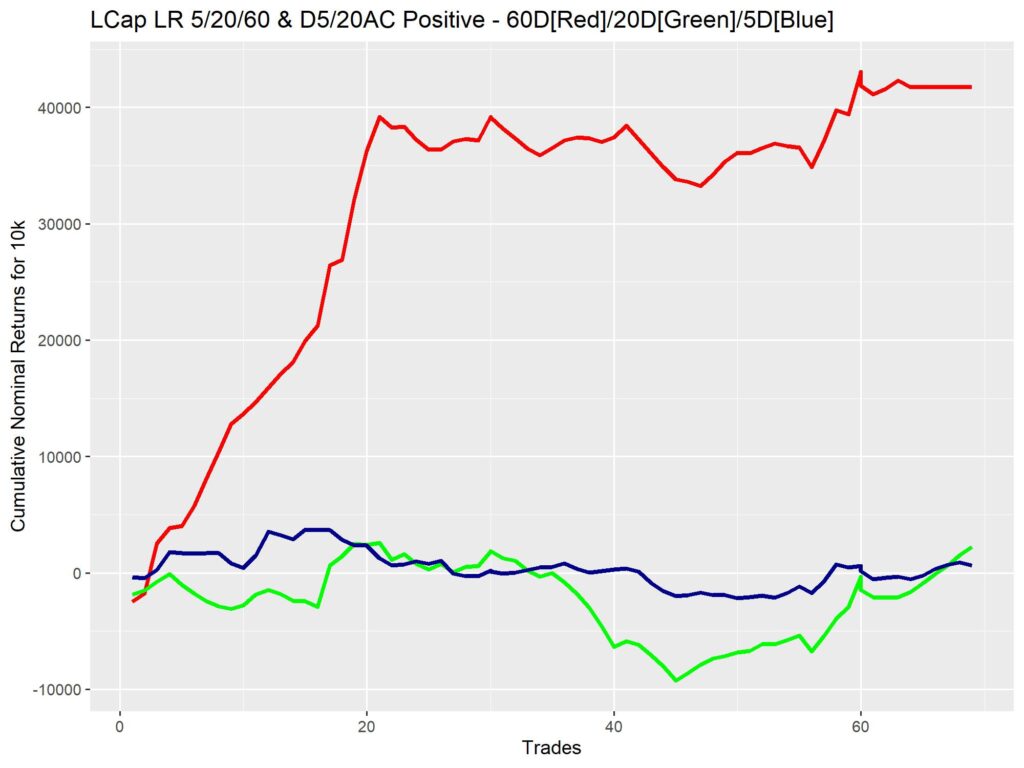
2. LR positive and significant for all windows (5/20/60D) and AC positive 5D window.
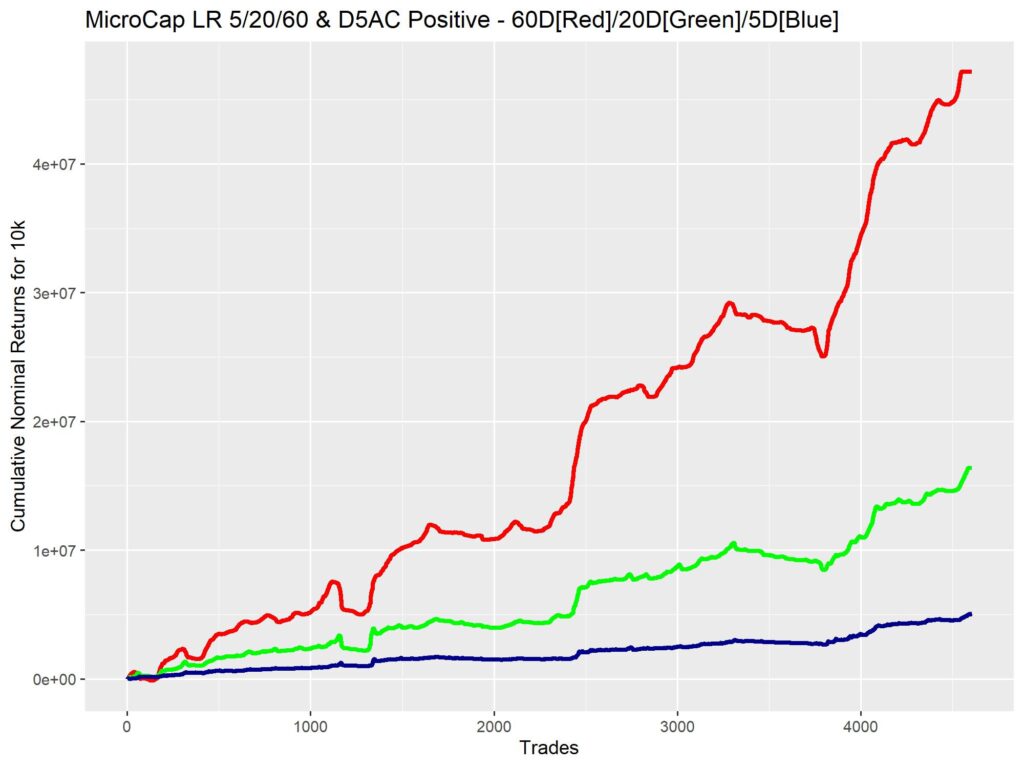
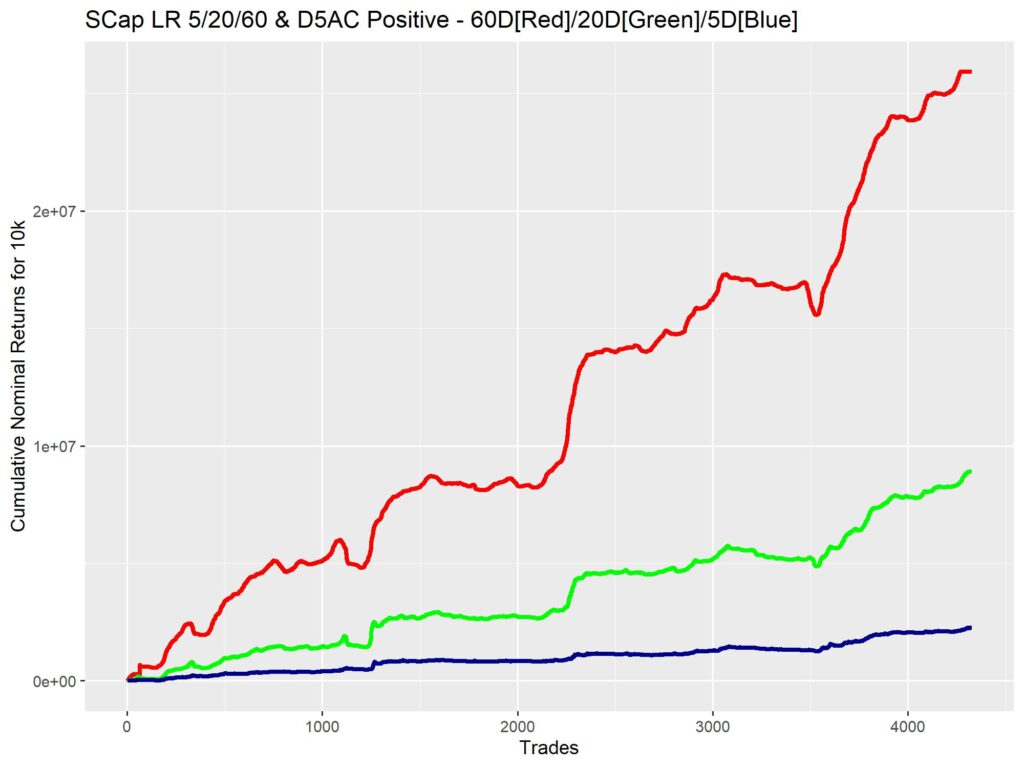
3. LR positive and significant for 5/20D windows and AC positive and significant for 5/20D windows.
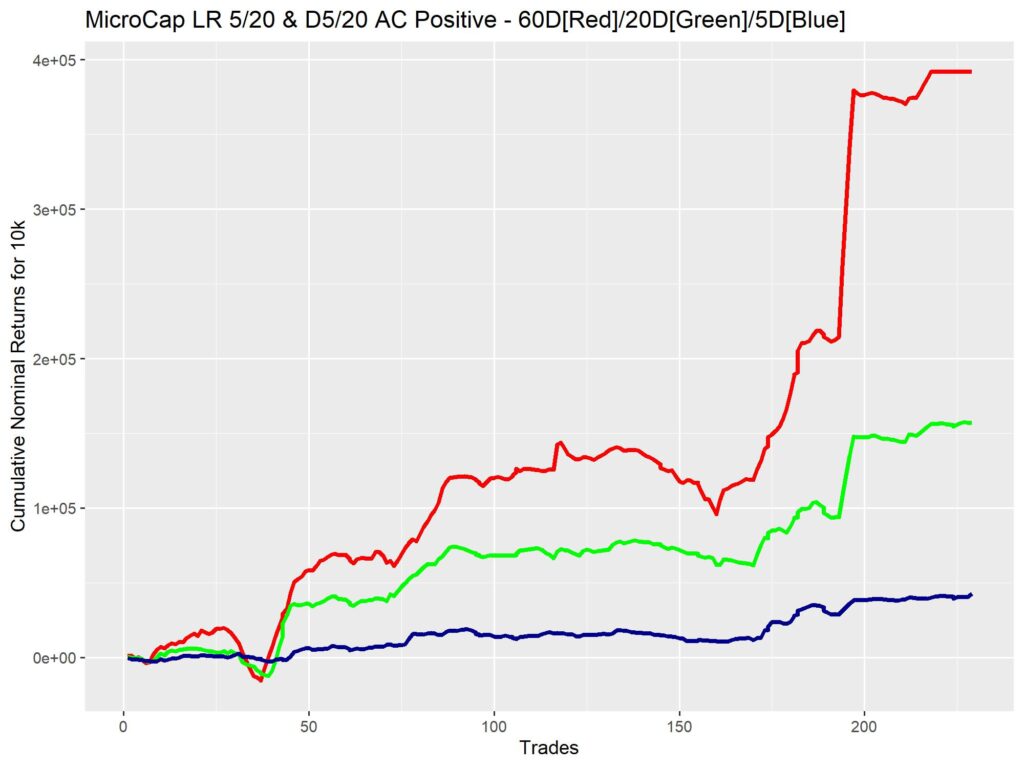
4. LR positive and significant for 5/20D windows and AC positive for 5D window.
DISCUSSION
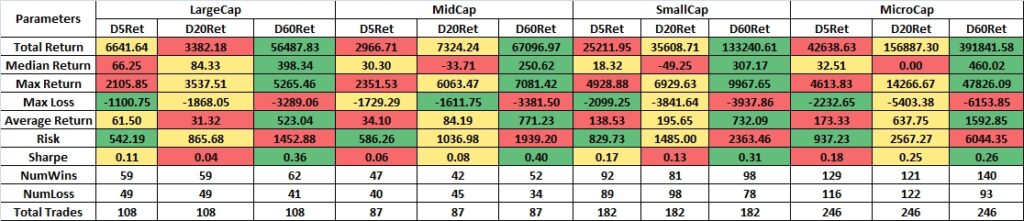
I know that the 5D AC window results look too good to be true.
But understand that this is over a period of 20 years. Look at the ginormous number of trades conducted during that period.
The win ratio though is pretty favorable, averaging 3:2, with the R:R being pretty skewed, especially in small and micro caps, held for 60 days.
LIMITATIONS:
1. Since I used current top 1k symbols for the backtest, there is an inherent bias of selection of only those with higher longevity, and hence probably better companies. But since our holding period is 60D, the criteria is based on trend (not fundamentals), and risk is only 10k per trade (if the company completely tanks), I am not too worried about this.
2. Using the 5D AC only, might lead to multiple selection of the same company over next few days after initial investment, and lead to return stacking (might call it “pyramiding”), and that definitely increases risk to a certain extent. But since we are playing non-leveraged, the loss is pretty capped. Again, not too worried about it.
3. The investments were fixed at 10k a trade, and not compounded. Might call it a limitation, but I’d rather say it is a blessing. The extra money can be used to diversify the strat across multiple stocks rather than go long a few stocks with larger investments.
CONCLUSION
This strat looks pretty promising, with easy selection of low risk/low reward with confirmation of 20D AC and high risk/high reward by considering only 5D AC. Can choose based on own risk tolerance. I like the looks of LR+ on 5/20/60D and AC+ on 5D, as the most useful – short term continuation of a long term trend.
Will come out with a screener for the same soon. Until then, Cheers.
PS. Please show some love by retweeting and liking the tweet which directed you here, and sharing with friends. Will be useful for maintenance of the website.
Maybe I blinked my eyes too fast
Any buying recommendation 😀
No recos bucco. This is purely for teaching and informational purposes only. I will be putting out a screener as a showcase, but if you choose to use that, the risk is entirely yours.
Heyo,
This looks really interesting. Would it be possible to share the code files you used to get to these results?
Being new to this field, it would help me out in getting a better understanding of the topic.
Thanks for the learning!
The backtest is still raw. I can share the code, but it is in R. Would it be of any use to you? I’ve not met any people on Indian Fintwit, who have the slightest inclination towards R.
R is no problemo for me. Will take some time but I think I will get used to it.
A suggestion: A repo link of sorts, wherein you publish the code behind all your findings would be really helpful in reproducing the mentioned results.
Thanks!
Pingback: Backtest for Stock trend analysis – ver. 2 - Alpha Leaks
Hello,
Please if possible share the R code that you have used to for Bonus and Splits Adjusting the Raw Bhav data.
Will do with the last post in which the screener will be unveiled.
Pingback: Path analysis of Stock trends - Alpha Leaks
Pingback: Stock Trend Screener - Alpha Leaks