We all know that the main Index of most countries is an upward trending asset class. Same for Nifty. Since its inception it has had a great run. The curious thing is that most of the gains of Nifty have been due to overnight gains rather than intraday gains. The following figures show the extent of the phenomenon. C2C is close to close change (1 day return). O2C is open to close change (intraday return). Gap is today’s close to tomorrow’s open change. Notice that Gap returns are more greener and O2C are more redder.

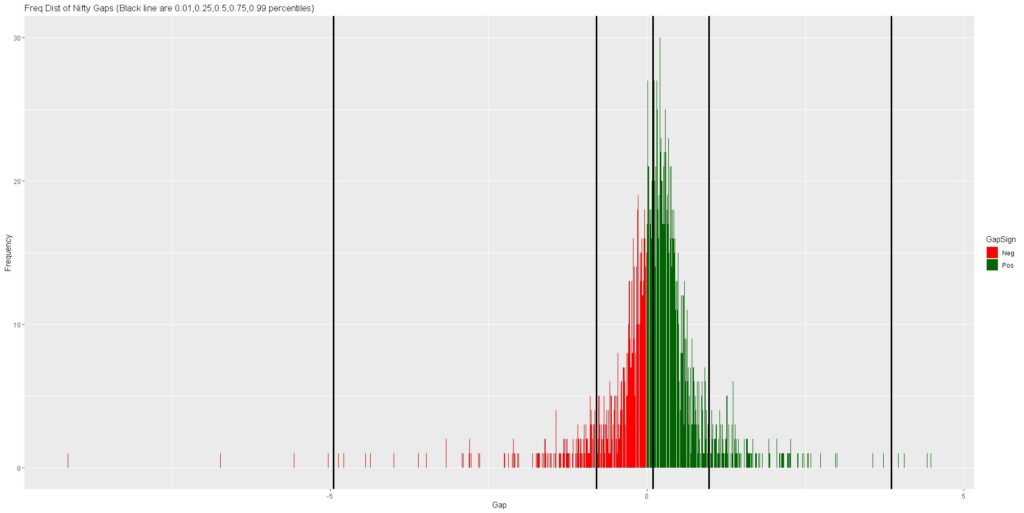
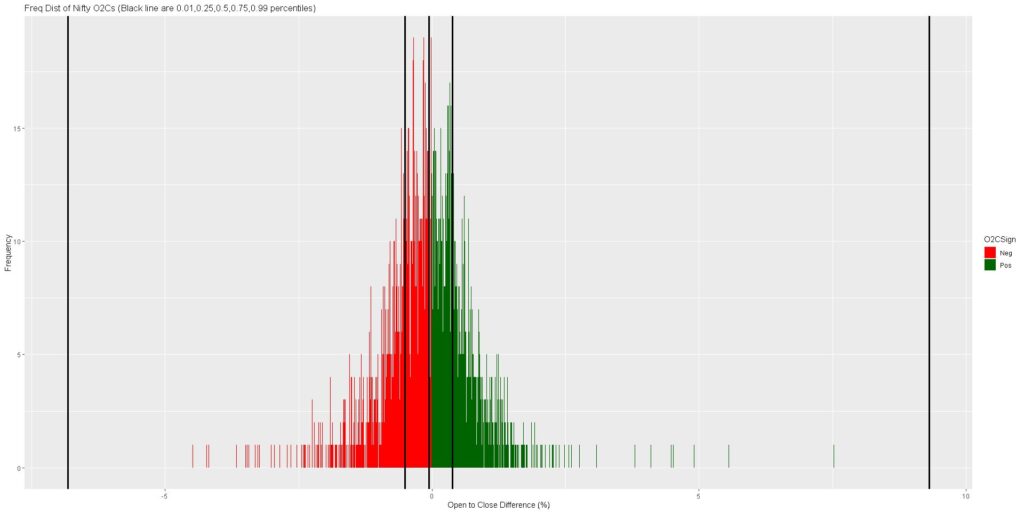
The phenomenon is consistent across the last 10 years. Those who wish to look at the images can follow the following link to a twitter thread.
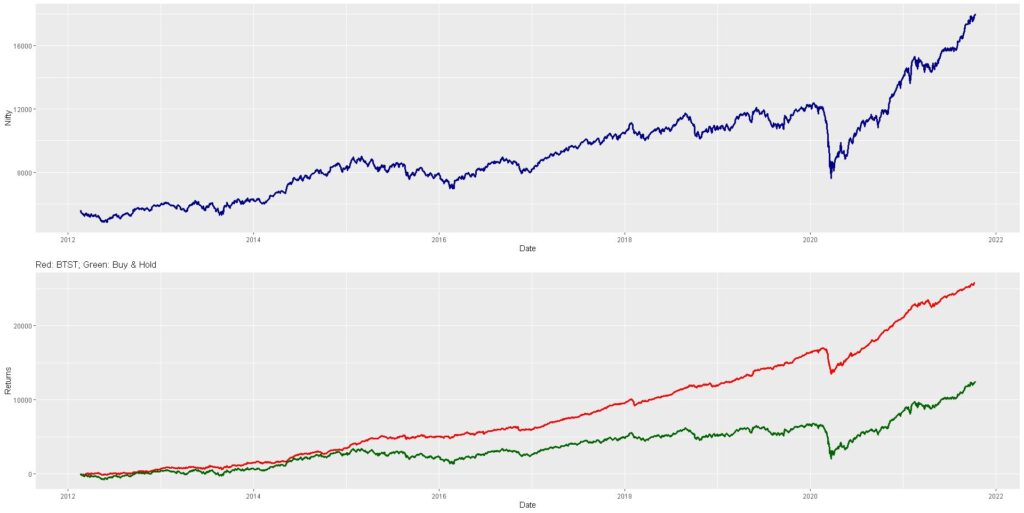
This is a curious phenomenon, with lacking explanation but gives a good probabilistic trade idea – Buy near close (buy today) and sell near next day open (sell tomorrow) – BTST. The following figure shows the cumulative returns of BTST since 2012.
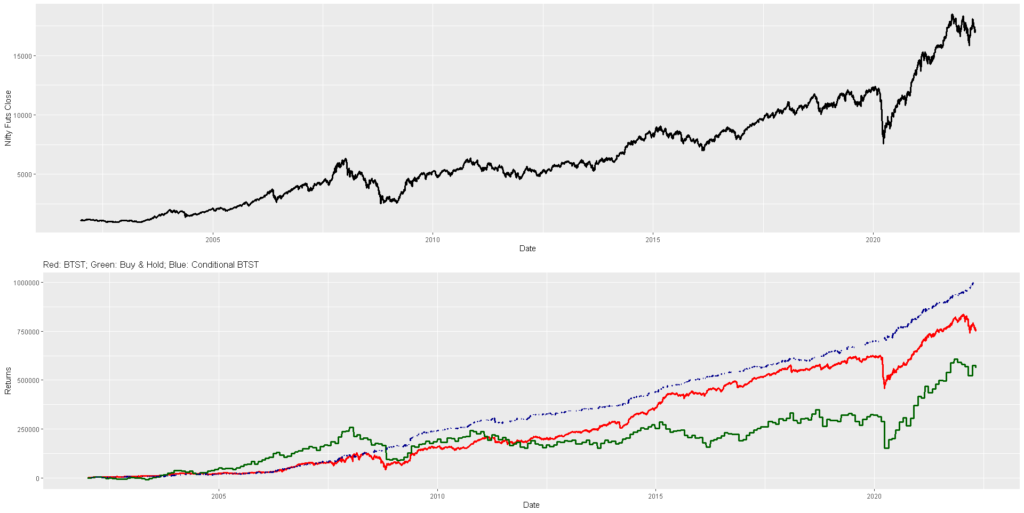
On replicating the same thing via futures segment, shows a similar result. The Futures buy and hold is simply rolling over at the end of month.

However, since this is quite a well known phenomenon and there’s no free money in the market, it is likely to be a crowded trade. With a crowded trade comes intense slippages. Hence, I did a slippage analysis based on random selection of Nifty futures prices during first one minute of market opening. The data is since 2008. The following twitter thread summarizes the analysis.
The analysis revealed that it was difficult to get a good sell execution at market open due to the slippage.
I looked for ways to improve the odds in our favor to reduce drawdowns. One of the methods I analyzed was a simple trend analysis. If in uptrend, then do BTST, else abstain. The trend was detected by combination of following indicators:
1) 1 day lagged, 5 day autocorrelation coefficient being positive (>0) – Indicates presence of trend
2) 5 day linear regression coefficient being positive (>0) – Indicates positivity of trend
Latest Autocorr and Linreg values
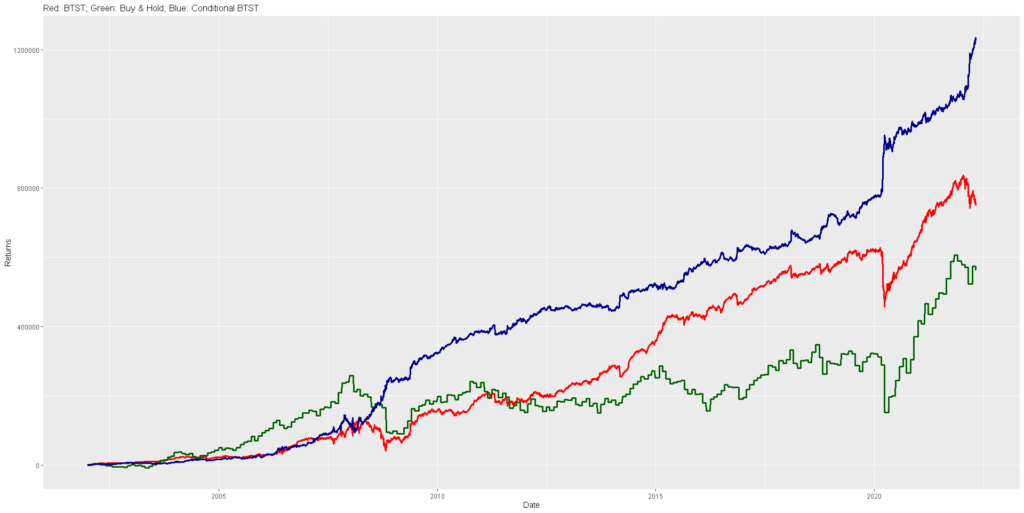
Adding these two indicators to BTST produced the following results in futures data since 2008. The conditional BTST outperformed the naive BTST even in simple cumulative returns (not even compounded).
Even with this working in our favour, slippages are always present due to it being a crowded trade.
What if we made the slippage work in our favour (go against the crowd) and worked with reverse conditionality? Meaning instead of abstaining from BTST when the condition failed, what if we did STBT? The following figure shows the real Alpha Leak:
The link below will give you the latest autocorrelation and linear regression coefficient values. Book mark it by pressing Ctrl+D if you want to visit this post again to get the latest values.
Latest Values of AutoCorr and LinReg
If you wish to understand more about Autocorr and Linreg for trend identification, click HERE.
Lovely Post here.
To calculate entry and exit prices, are the futures used or SPOT?
The later ones are futures. Only the first line graph is spot. Wherever you see the comparative Nifty buy and hold to be “squarish” (discontinuous) is futures data.
Hi, for the linear reg coefficient, what are the dependent and independent variables? Please excuse my innocence 😛
The dependent is the close value and the independent is just a serial number. Basically the slope against a variable increasing by 1 at each step. Tells the average change in the close value of the index per day. And never be ashamed of not knowing. Its by not knowing now that we have the tenacity to know more the next moment.
Thank you so much 🙂 Really glad you responded!
I have worked out the same. The indicator values match with your daily updates, but the backtest results are no where close to your nos. Can I share my file to you for a check?
Hey @dhritiman, @Anil
I also ran the backtest on the above mentioned approach, but the results do not match at all. Adding the LR and AC condition seems to hamper performance and not improve it.
@dhritiman would it be possible to share your code files for the backtest? It would help us sort out the discrepancy.
Thanks!
Pingback: AutoCorr and Linreg Technique for Trend - Alpha Leaks
Hi ,
Good Day,
Request you to please write an article how to calculate auto-correlation and linear regression .
So that we can be sure that we are doing it correctly.
Pingback: Yeh MC Monte Carlo karte kaise hain? - Alpha Leaks
thanks man. how to read & utilize this indicator ?
I think that is provided in the article itself. The conditions when to long and short.
Nice article. Can you pls let me know an easy way to calculate auto-correlation and linear regression values? Trying to see if we can automate this whole workflow.
Easily done on any programming language. I personally work through R, where the functions are acf and lm. I suspect there are similar functions in python as well.