Since May has begun, thought I’ll do a small piece of research to provide a look into what actually to Nifty happens in the May to October time frame versus November to April time frame.
Data derived from NIFTYINDICES website (Nifty data from 2000-2023 April).
First let us look that the returns from the two time frames. The days within each year’s time frame have been coerced into a numerical index called “Day Index” (for ease of mapping out paths). The returns of Nifty spot as percentages relative to the first day of each series are presented below.
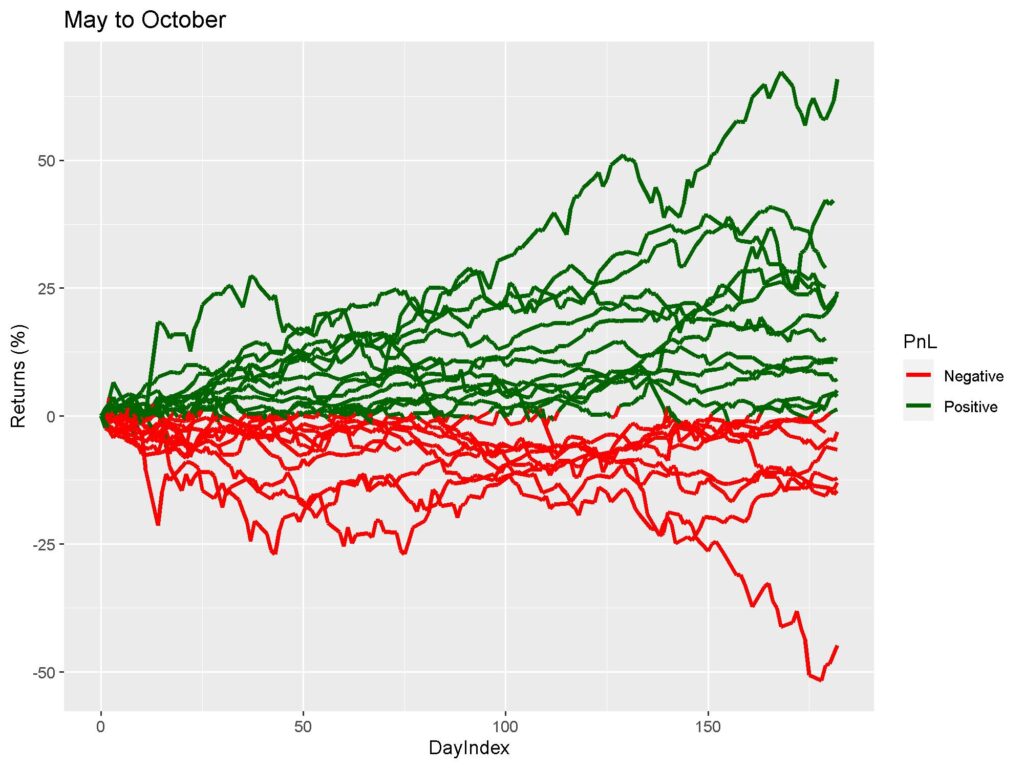
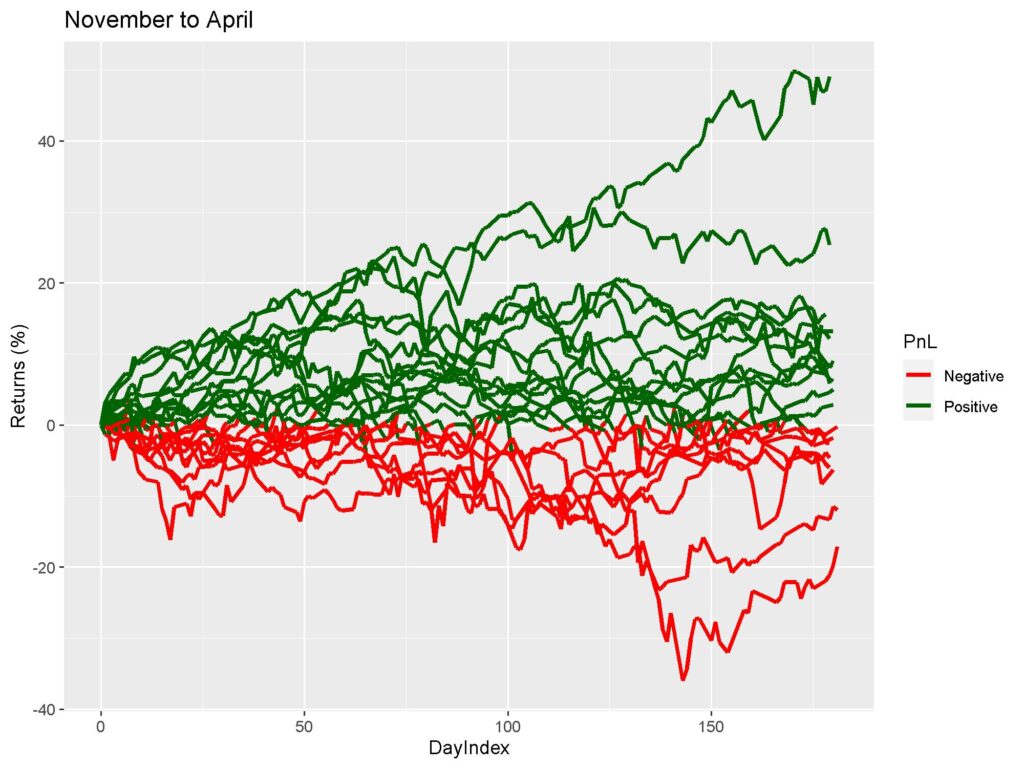
Hmmm. Somehow looks like May to October time frame has better returns. Let’s test it out statistically.
For this piece of analysis, am breaking out a relatively advanced technique (compared to the usual summary stats I present).
This type of modelling is called “linear mixed effect modeling“. It helps us to partition out random effects and get a better look at the main effects within the model [i.e. average difference between the time frames (Nov2Apr (Ref=May2Oct) in figure below), average change across each day after accounting for effect of the time frames (DayIndex in figure below), and if the average trend of change in each day varies between the two time frames (Nov2Apr*DayIndex in figure below)].
I assumed that intercepts for each year would be randomly changing and the intercept for the change within each month would also be random while randomly varying within each year (these are the random effects specification that I did for the model).
I tried to include randomness in slopes of change also, but the models didn’t converge. This model was the best model after converging based on the AIC (Akaike Information Criterion).
The model results are summarized below:
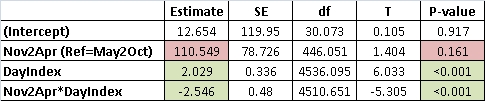
How to Interpret:
1. Main effect – Nov2Apr (Ref=May2Oct): The average returns within Nov2Apr timeframe were higher than May2Oct timeframe but wasn’t statistically significant. Meaning, this average difference of returns could be due to chance.
2. Main effect – DayIndex: On an average, after accounting for whatever difference lies between the two timeframe, Nifty increases by 2 points everyday.
3. Interaction Effect – Nov2Apr*DayIndex: The Nov2Apr time frame’s per day change is 2.5 points lower than May2Oct timeframe.
If this doesn’t satisfy you. just look at the model fit qualitatively by looking at the figure below.
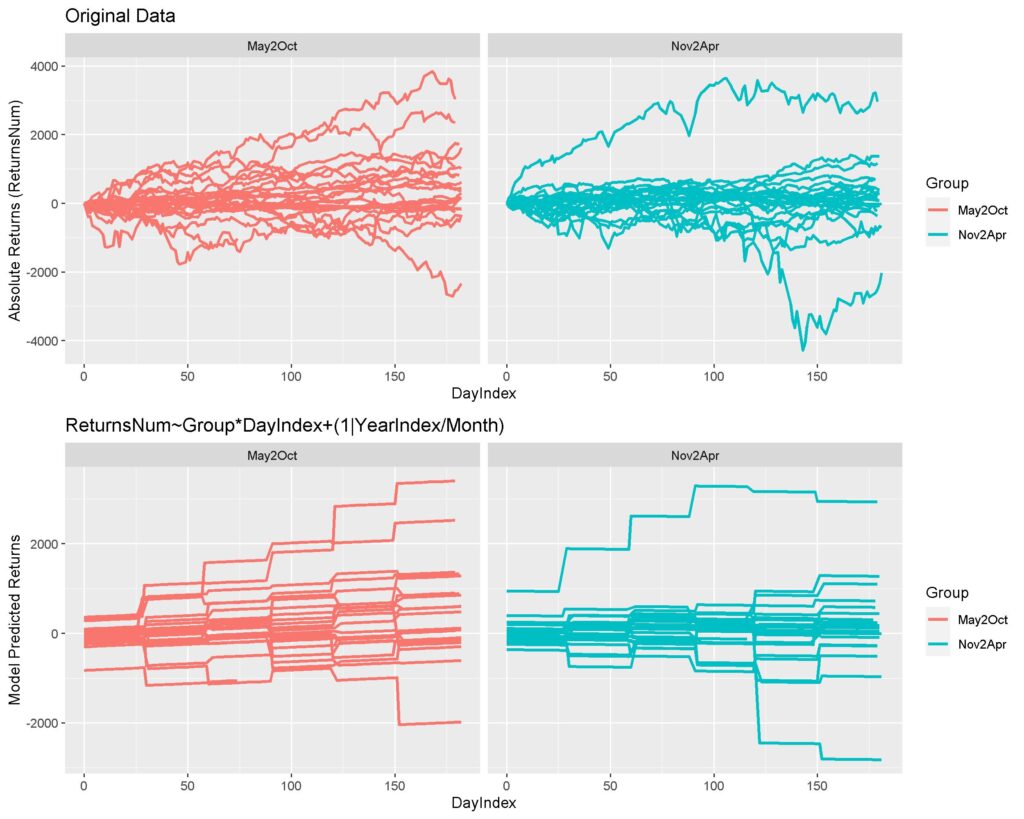
TLDR: Sell in May and Go Away is a myth and should be dumped in the dustbin for useless mythologies. The average returns in the May to October series are actually higher. You should actually “Buy in May and Stay that Way”.
Hope this was useful. I know it is dense in stats, but sometimes, its just fun to do it the right way. Cheers.
Thanks, +
very good
Thanks David. Much appreciated.