In investments, all strategies can be boiled down to two basic philosophies:
1. Something is going up, and you bet it’ll keep going up (Momentum)
2. Something is going down, and you bet it’ll reverse course soon (Reversion)
The problem with the Momentum strat is that you buy something expensive, hoping it’ll become more expensive (thus needing defined exits as TSLs or time/price target).
The problem with Reversion, is that it might not revert and continue to fall, hence prolonged DDs (unless you have SLs in place).
Since most people hate seeing red in their portfolio, Momentum strategies have become the preferred strat. Its simple, intuitive and frankly just works.
This post is meant to explore whether we can ensure that buying an index with the hopes of reversion can be optimized to prevent long periods of DDs.
Any such reverting strat will have three conditionals when it needs to be systematized:
1. Detecting a prolonged period of negative returns (taken as 3 months – 60 days)
2. Detecting a reversal of trend.
3. Ensuring a short period of positive returns before buying in (taken as 5 days)
Of course, these parameters can be varied to make it more optimized, but that is left to the reader to implement. This post just aims to provide a crude proof of the concept using a simple backtest on raw index values.
METHODS
Data: Index data from Feb 2012 to 20th July 2023. Raw data available HERE
Methodology:
1. Clean the data (obviously, the data is nasty)
2. Select out the Indices you want and split the dataframe to a list with each element being an individual index.
3. Order the Index data by date.
4. Slope60: Create a vector with linear regression coefficient of close values over time with a rolling window of 60 days.
5. Slope5: Create a vector with linear regression coefficient of close values over time with a rolling window of 5 days.
6. Autocorr: Create a vector with 5 day lagged autocorrelation over a rolling window of 20 days (experimented with the lag value a bit and chose 5 as it an appropriate compromise between getting decent number of trades and confirmation of reversal)
7. Create vectors for C2C returns of 5, 20 and 60 future days (time based targets)
8. Create a conditional vector, where sign of Slope60 is negative AND Slope5 is positive AND Autocorr is negative.
9. Filter the dataframe using TRUE conditionals and compute summary statistics on D5Ret, D20Ret and D60Ret after indexing the returns to some specific investment amount per trade (here, Rs. 10000)
10. Cumsum the indexed returns to create equity curves for graphing.
The raw data with computed conditionals can be found HERE
The data after executing the conditionals and computing PnLs can be found HERE
The PnL summaries and graphs of all Indices can be found HERE
The R Syntax for the same can be found HERE
RESULTS
Since I’ve computed the same for some 26 odd indices, and many are fairly new, in the interest of parsimony, I won’t dwell on all those. Presenting the PnL graphs and summary statistics for the important NSE Indices.
B&H is buy and hold. The graphs will look “blocky”, mainly coz the trades happen infrequently. The B&H graph looks janky coz the PnL is indexed to those same dates at which trades were conducted.
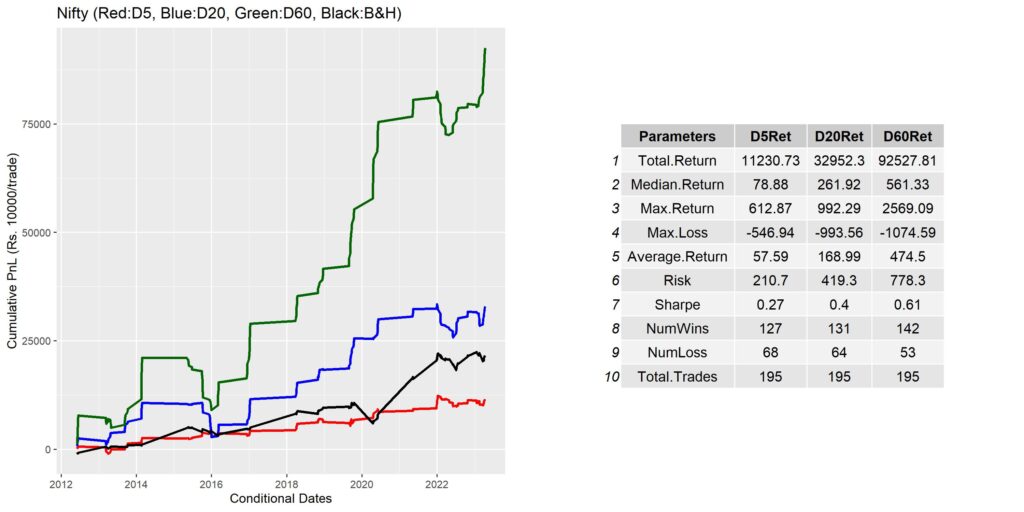

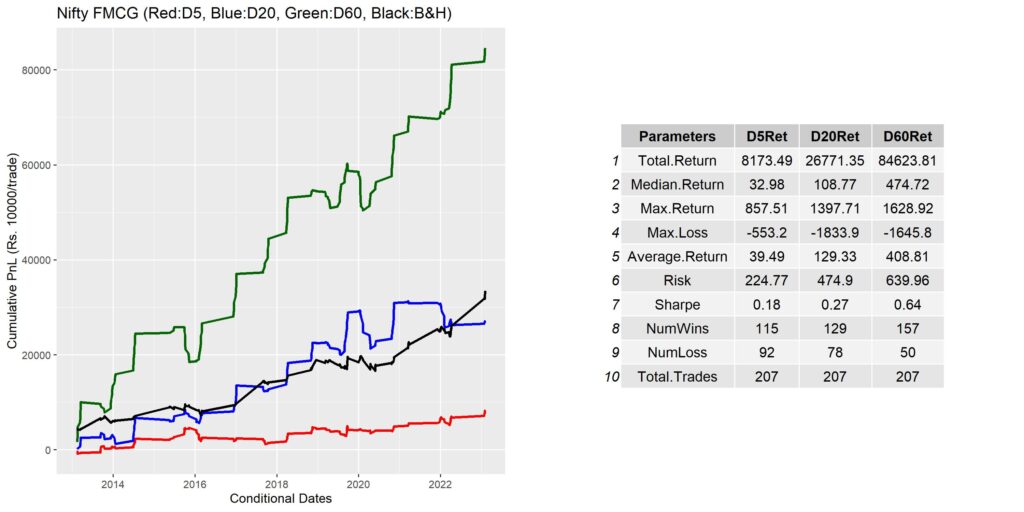


DISCUSSION
Not really much to say. Looking at the graphs, I guess computing p-values etc. is moot. The returns for D60 after the buy condition is pretty strong. Add to that, the returns are not even compounded. Add to that the probability of win is quite high.
After a bit of tweaking and testing on actual ETF/Futures instruments, it might actually turn out to be a good strategy.
The method, you must have notice is pretty simple, and aims to take benefit of reversion, to time an index which usually drifts up. Its meant mainly to increase efficiency of investments.
LIMITATIONS
1. Was conducted on raw index values.
2. The D60 returns are super stonking mainly due to stacking up of 10k inputs over the course of an index volatility. Basically, multiple parallel investments during the time period of the first Buy signal around that time (might be helpful if you manage a scaling in type of investment style).
Hope this was useful guys/gals. Please let me know how you feel about it on twitter – @Dhritiman_Ch, or comment here.
Share it around if you liked it. Cheers.
How long is the holding period after taking the trade?
D5 is 5 days, D20 is 20 days and D60 is 60 days.
Pingback: Catching the bounce: Improved - Alpha Leaks
My family members every time say that I am killing my time here at net, but I know I am getting familiarity daily by reading thes fastidious posts.
Thanks man. Good for you. 🙂