When I first read Kora’s book – High Profit trading patterns, what stayed with me was not the patterns, but the way he analyzed the data to get a probability estimate of returns and act on it.
Financial market data can be viewed at its simplest as a mix of random (stochastic) and fixed (deterministic) changes. The random is far higher than the fixed. But, when we create conditions, we can get probabilistic estimates of returns, given those conditions.
For example,
We look at daily returns of Nifty.
What are the returns of any day on Nifty? (Broadest – No conditions)
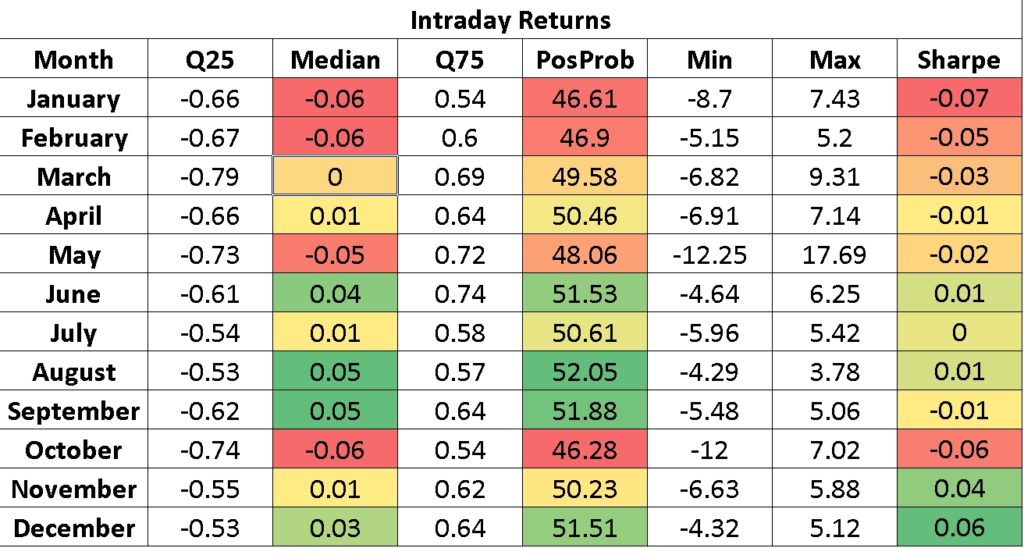
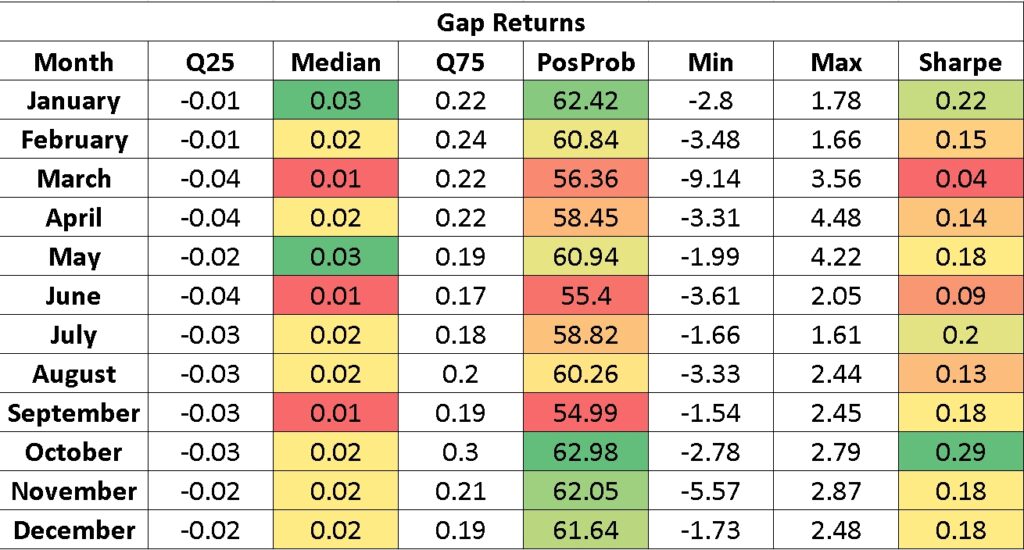
This question can be divided into three parts – Daily Returns, which is broken into Returns on Gap & Returns on Intraday.
The probability of a positive return on each of these (Data from Jan 2000 to Junly 2022), is 59.5%, 59.6% and 49.6% respectively.
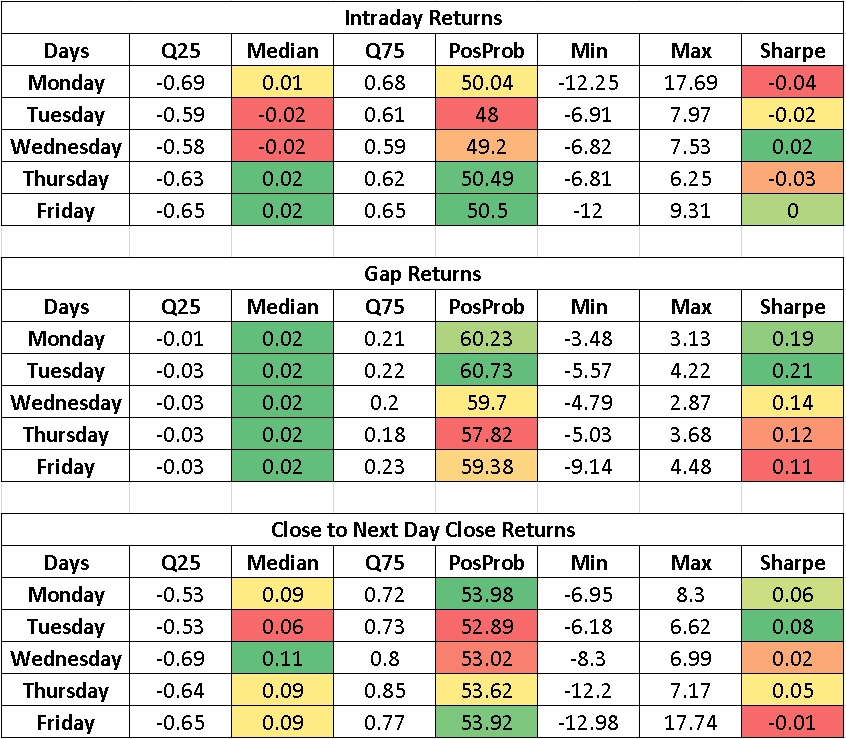
Since we know that Nifty as an asset has derivatives associated with it, and the derivatives have an expiry, and those derivatives are hedged using actual stocks of the Nifty, means that days of the week might have some effect on returns.
Hence we break the data into sets of days of the week (first condition) and analyze the same question – probability of positive return. PosProb in Figure below.
Gives us a good clue – Focus on Gaps on Monday and Tuesday. Also, Gaps are far more likely to give positive returns than Intraday.
Next we know that institutions, usually work on a calendar basis due to regulatory concerns. And they are the actual movers and shakers in the market. Their rebalancings, covert activity, new fund offers, tax concerns etc. can give significant seasonality to months of the year. Hence we analyze the same question with a condition of Months of the Year.
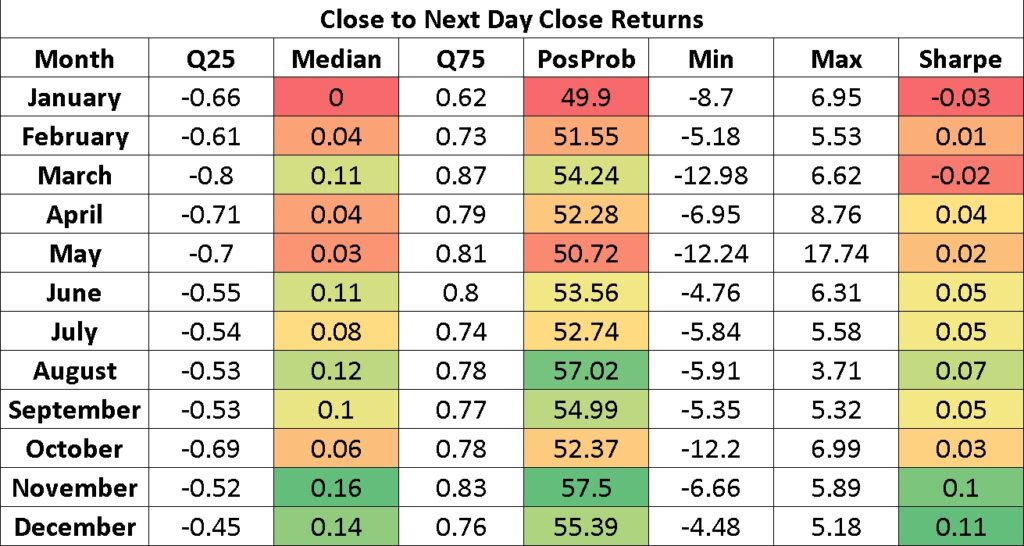
This gives us our next clues:
1. Gap Returns are far more Profitable in October to February period.
2. Gap + Intraday fall is common in October, January and February.
3. August has the highest Intraday gains.
To delve deeper into this requires more “fundamental analysis”. But we press on with a deeper conditional. What if we married the monthly and the daily conditionals (one way would be to just multiply the respective probabilities). Below I give the actual historical probabilities of a win. The image will be pretty long (not very visible on a phone – but that’s the nature of stats) – For closer inspection, just right click and open image in a new tab.
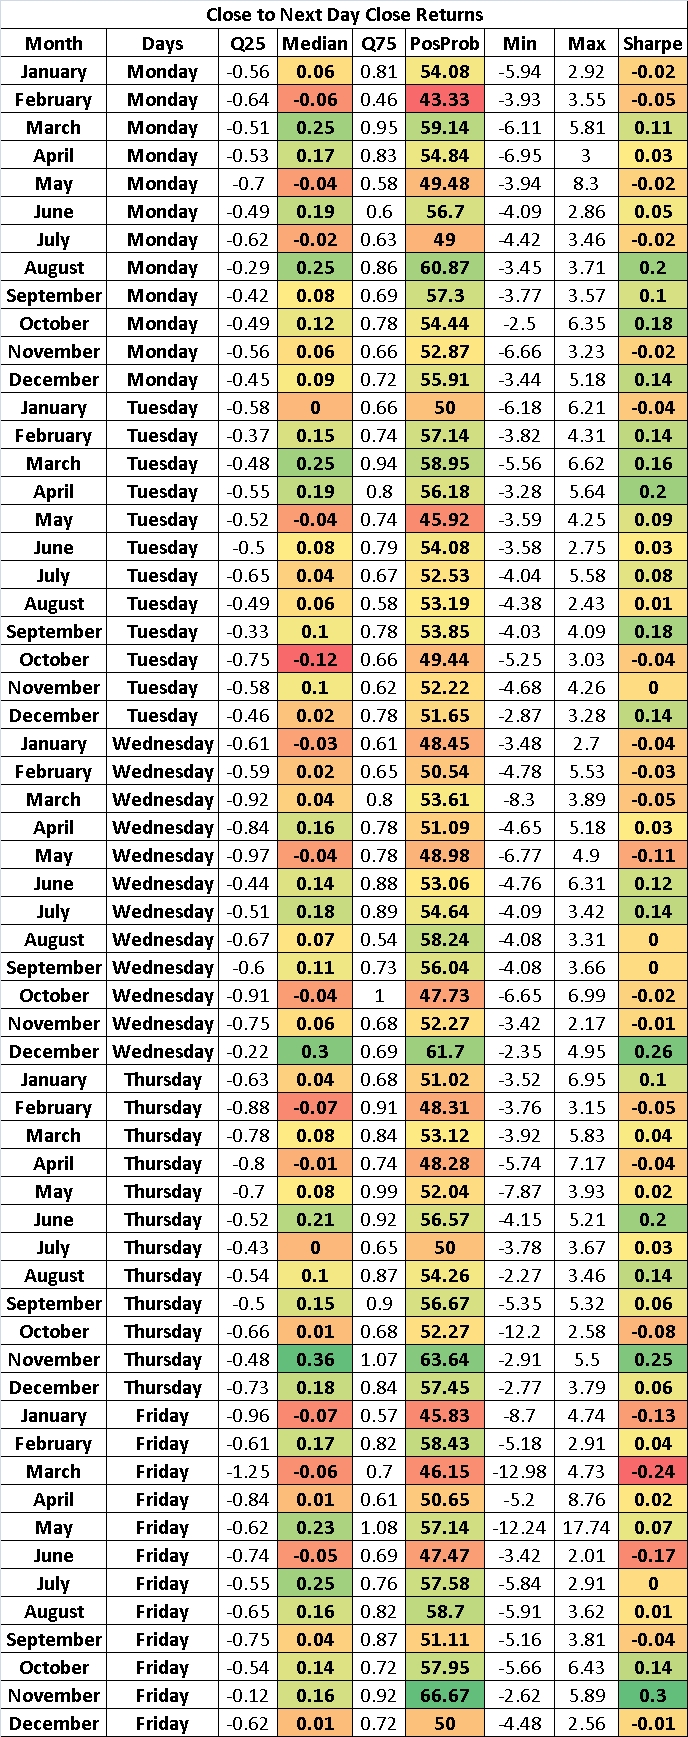
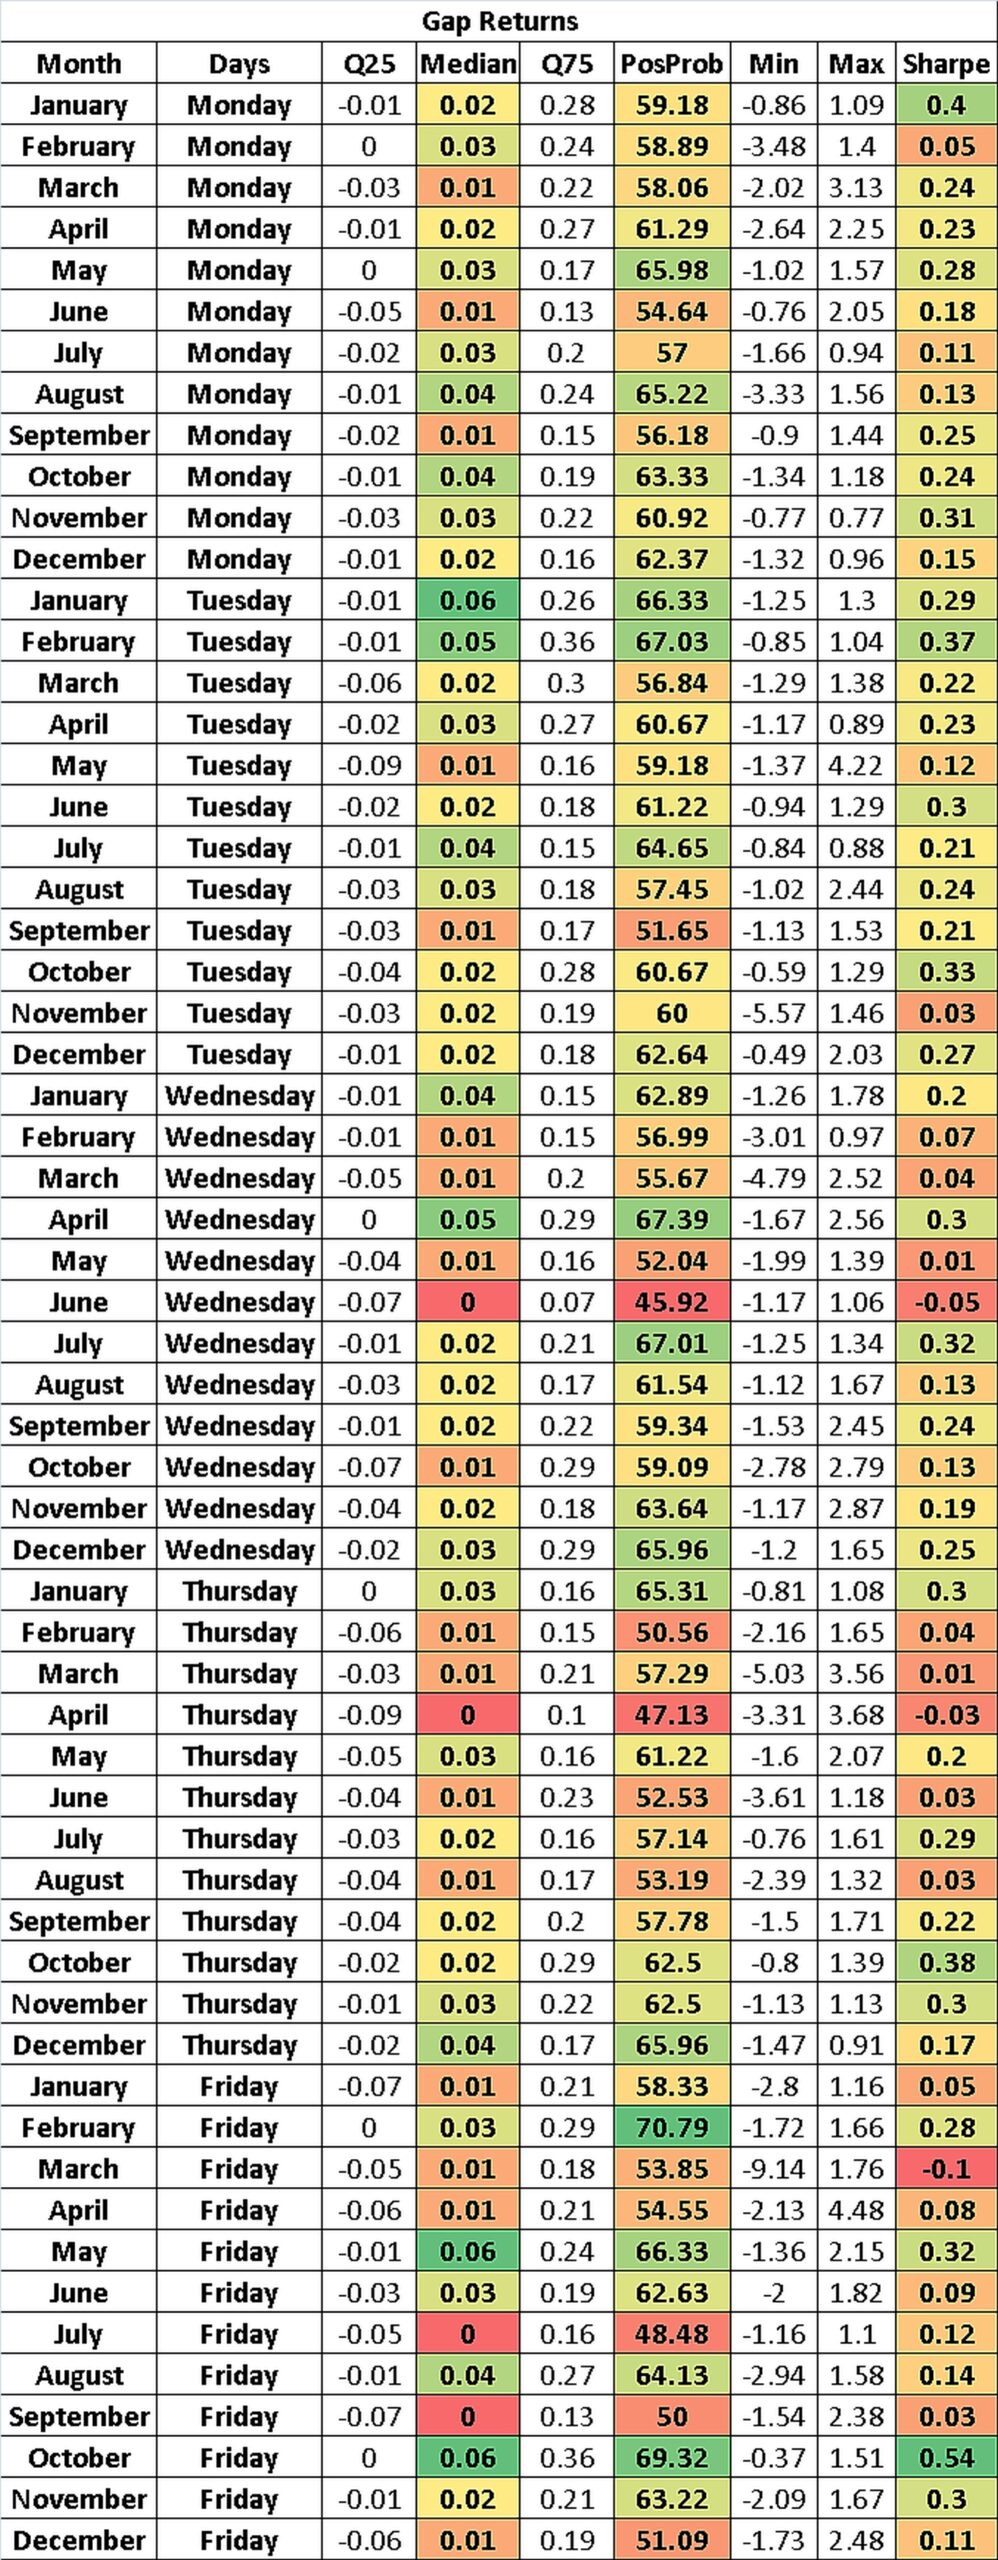
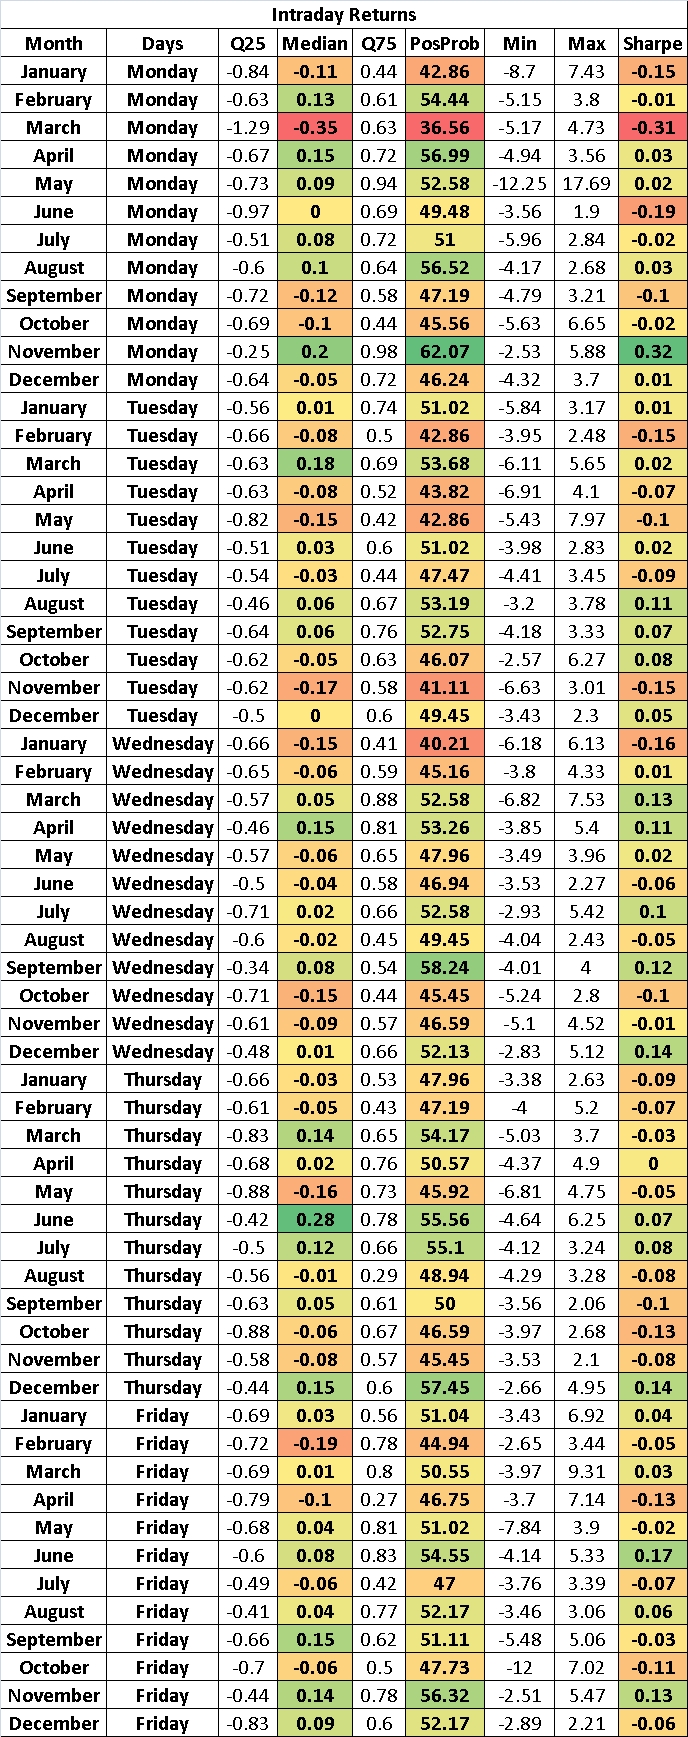
There are quite a few positives in this, and one might be enticed to trade these. But the old adage comes into play – “Historical returns are not representative of future returns”. Hence risk management.
Next up would be seeing if the results were consistent across all the years. But you can surmise from the above images that that table is huge. So just putting up a link here to download the .csv files.
1. Intraday Returns.
2. Gap Returns.
3. Close to Close Returns.
This post was mainly to get people thinking along the lines of how Kora thinks. Nothing is “feelings”, everything is “run the numbers and see”. Hope this was helpful.
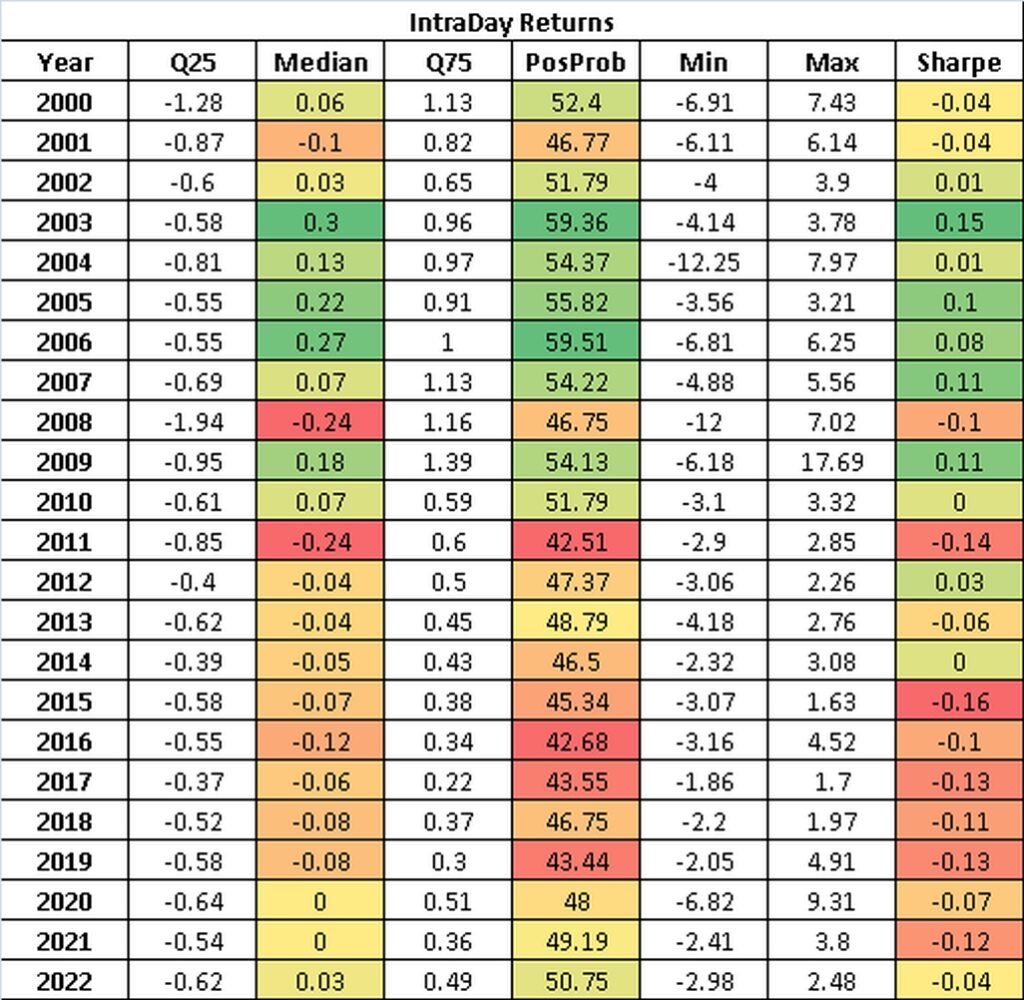
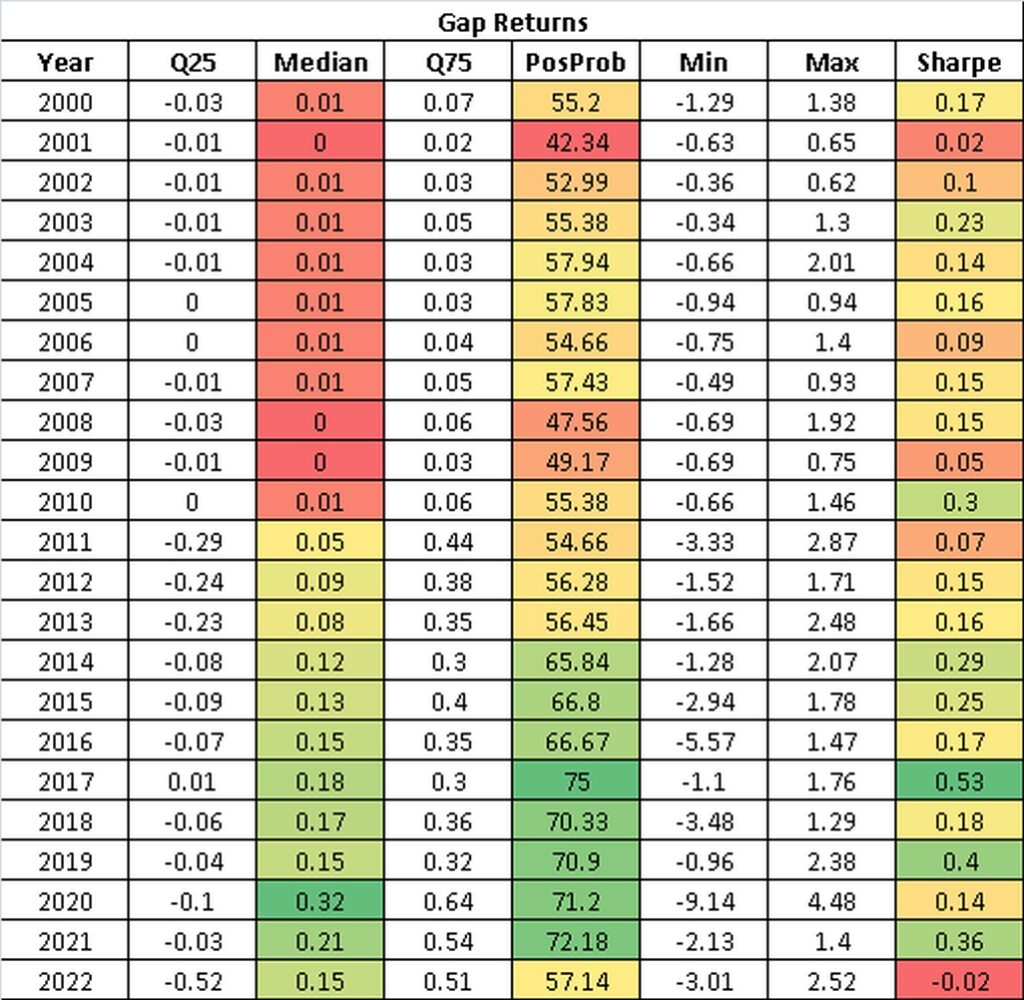
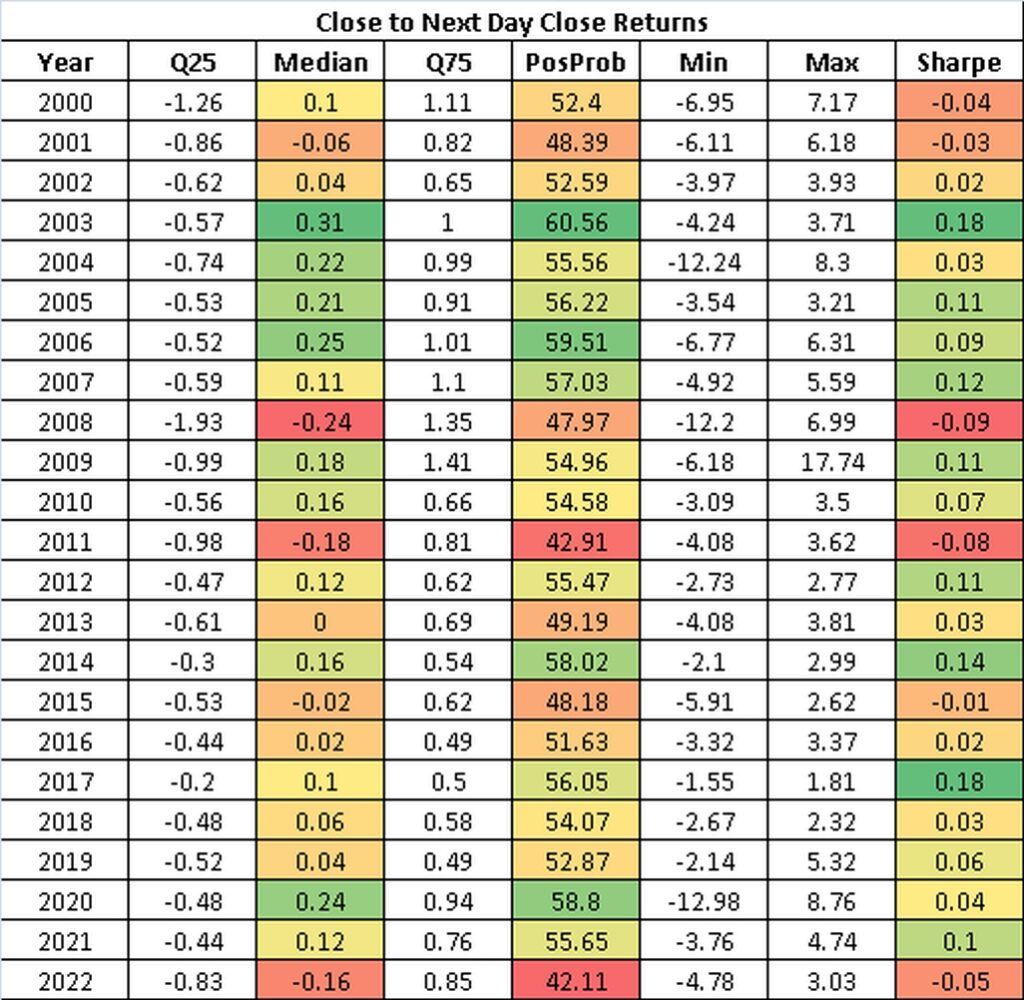
PS. Adding a separate section on Yearly summary of returns (demand on twitter). Please check the images below. Some interesting findings in these.