A lot has been said and discussed about the VIX ticker. What it means, what it indicates, how it is a victim of childhood abuse (it was both supported and resisted) and many others. This post doesn’t address any of those issues. The fintwit community has discussed it to death, and I cannot really bring much value to that discussion beyond what has been already said.
What I can do, is to bring to fore its utility as an indicator. In today’s market (where options are sold as potatoes, by the kilo), in the bid for daily yield, selling of options has burgeoned to such an extent that it is likely changing the IV term structure and by definition pummeling the VIX. That brings us to an interesting question – what defines “low” VIX?
Before we get into this, let’s observe what the distribution of VIX looks like (is it normal?, is anything ever truly normal?, does it vary with perspective – lookback period?). For this I made a delightful soothing video showing the evolution of VIX distribution since its inception. Notice the smooth 2017 adding a smooth left hump, and the March 2020 crash adding a permanent right tail to the distribution. This also brings up questions like, how useful are cut-offs for strategy implementation when it comes to such non linear systems (think about it). Enjoy the video below, and then get on with reading the rest of the article.
Below you’ll see the deciles of VIX since its inception (data from from daily Index data from NSE).

Reasonable to make cut-offs for low and high VIX at <10% and >90% decile levels. Thus for the rest of this article, Low VIX is defined as VIX<12.47 and High VIX defined as VIX>22.9.
The following graph depicts the times in Nifty’s history when it was at said levels. The chart starts after 2014, since that’s when the VIX data starts.

How Nifty performs when VIX is High or Low?
Before we go on to play with backtests of derivatives, let’s first look at the movement of the underlying (Nifty spot) after VIX reaches above levels. The following analysis shows the summary of performance of going long on Nifty spot after VIX high or VIX low signal is received.
Looks like, either ways it doesn’t matter. On an average, going long leads to a positive result in the long run. Shorter periods have smaller profits and have a higher risk of loss, compared to longer holding periods. Higher profits result from going long a high VIX environment. From an long term investment standpoint, buying Nifty ETFs when VIX is higher than 22.9 is definitely a good strategy. It also pairs nicely with my negative momentum Nifty buying strategy discussed HERE.
How to play the signal using derivatives?
Since derivative returns are leveraged and time sensitive, the path of the PnL curve cannot be disregarded.
Since high VIX is usually seen in a crashing environment, and low VIX can easily be followed by a crash in Nifty, just going long via futures is a bit iffy strat.
However, going long a ATM straddle via options is definitely an option.
A short tenor straddle (up to 2 months to expiry), increases risk of theta loss, and is not optimal when observing that biggest moves happen in 60-120 day range.
A longer tenor straddle (>=3 months to expiry) theoretically has more vega loss worries which are more prominent when buying the straddle in high VIX environment. Or does the delta gain compensate for the same? And are the small Nifty moves inherent to a low VIX environment helpful in terms of delta profits? Since max big moves happen in the longer timeframe, are ultralong tenors (>90 days) better?
Thus the research questions are as follows:
1. Which is a better indicator for longing straddles- High VIX or Low VIX?
2. Which tenor is better – Long (up to 90-100 days) or Ultralong (beyond 90 days)?
Methodology:
1. Find dates with high or low VIX.
2. Find options on those days with days to expiry (D2E) upto 180 days.
3. Long tenors are the highest expiry date found within the above range.
4. Short tenors are the second highest expiry in the above range (this method was needed to remove weeklies from being selected).
5. Find the closest strike to Nifty spot rounded to the nearest 500.
6. Follow CE+PE (straddle price) of that strike and tenor to its eventual death.
7. Graph out the paths.
8. Summarize the eventual PnL of all paths into easy statistics.
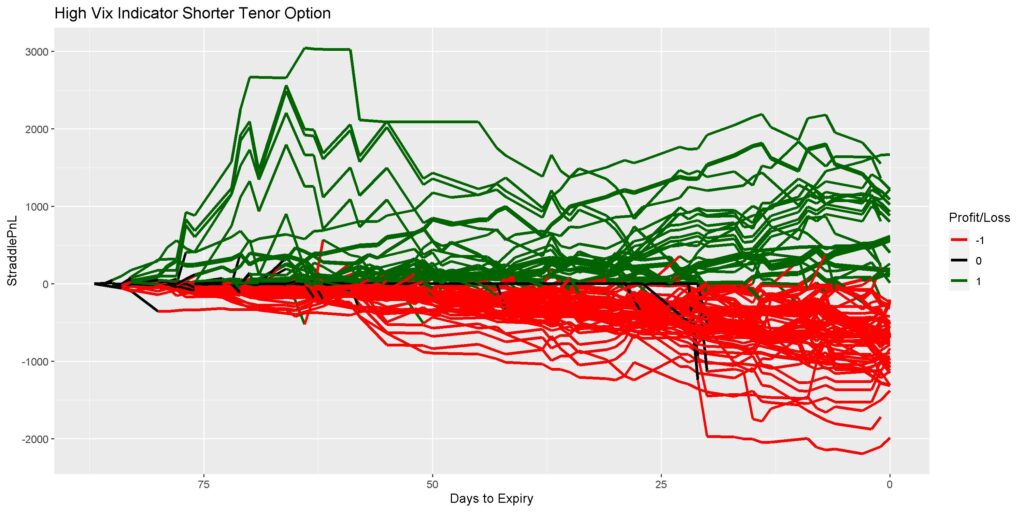
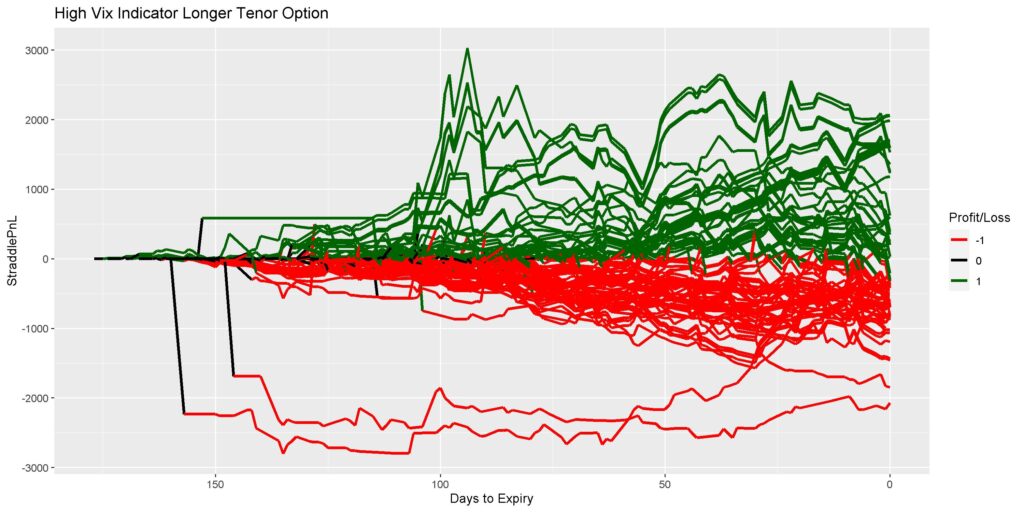
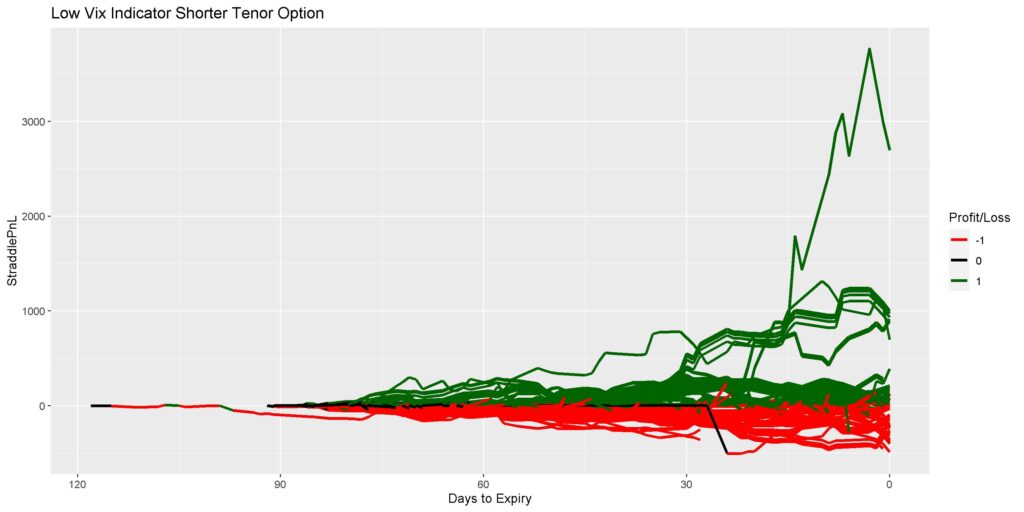
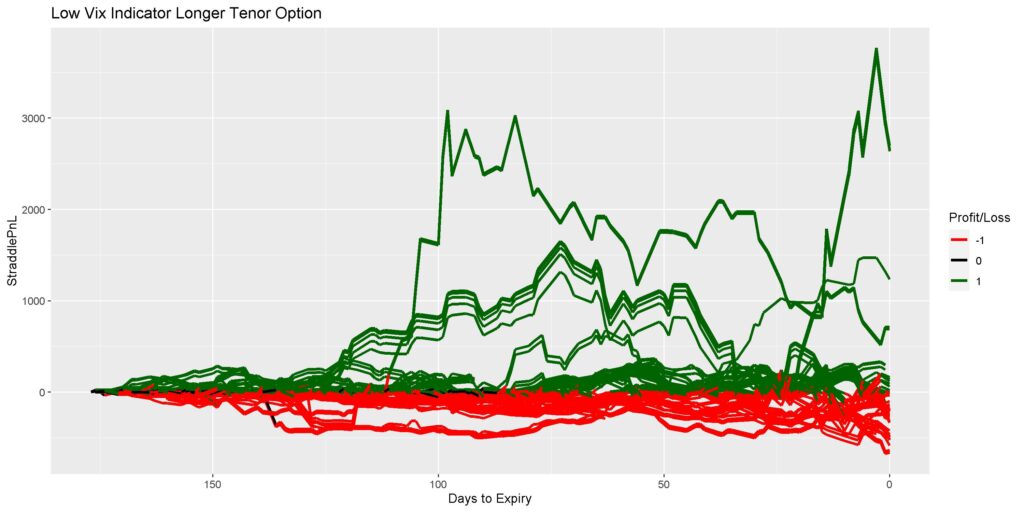
The following graphs show the PnL paths of each of the selected straddles for High/Low VIX for Short/Long tenors.
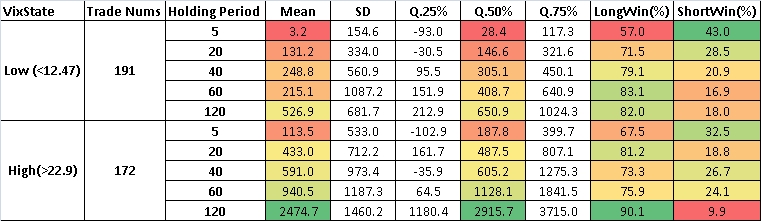
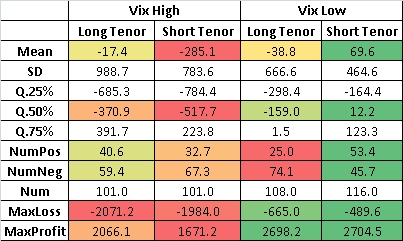
Below you’ll find the summary stats for eventual (holding till expiry) PnL of each of the strats.
Discussion:
Looking at the above its easy to surmise that buying a straddle, when VIX is low, for a 90-100 D2E option is the most profitable strategy with a win rate>50%. The max loss is lowest and max profit is also highest in the same strat.
Limitations:
1. Close values of straddle prices were used for buy (better is to randomly select between high and low of the day).
2. The paths were displayed but not analyzed for monetization (that’s the hard part about buying options – knowing when to sell)- they were held till expiry.
3. PnL attribution to greeks would have made the analysis way more fine grained.
4. Monte-Carloing the paths would have given better understanding of the paths themselves.
5. No statistical tests were conducted to see if the difference in PnL was due to chance or not.
For those enterprising enough to try and circumvent the above limitations by their own analysis, the path data can be downloaded HERE.
Hope this was useful. Please share around, if you loved it. Until next time, Cheers. 🙂