Many have wondered why I chose some esoteric analytics for identifying trend. I mostly answer dunno. Haven’t really compared it against other trend indicators. Just seemed intuitive to me, so I continued with it.
Here I’ll attempt to explain why I chose these. To answer that thought process, let’s ask. What is a trend?
For me, trend is a continuation of price changes in a single direction (that’s obvious). But for trading or analysis, what also matters to me is the smoothness of the trend.
Carefully look at the figure below.
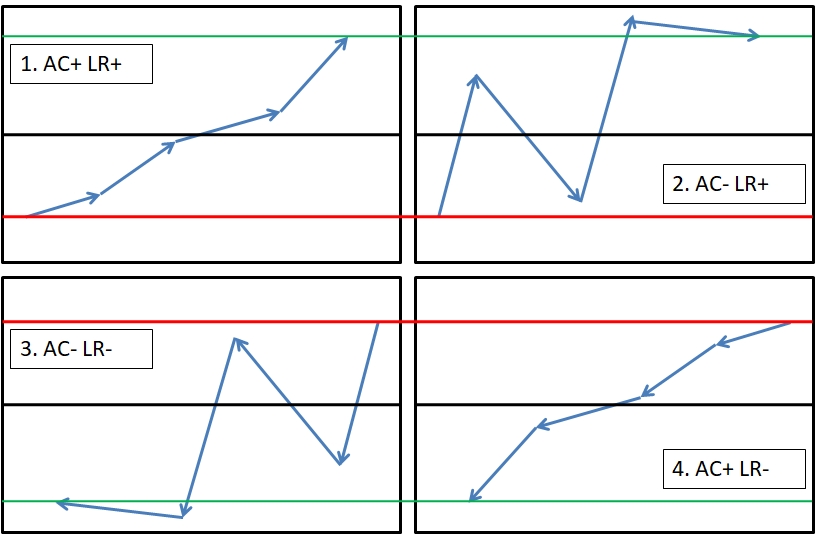
Panel 1 and 2: In 4 days, price goes from red line to green line. However, in panel 1, the price action is smooth. Basically forming higher highs. In panel 2, the price action is ragged. If you do a smoothening (SMA) in both, it’ll point up (either smoothly or with some wiggles). If you do a linear regression forecast, it’ll be positive for both.
However, any trader worth their salt wouldn’t place a bet on panel 2 for trend continuation, while panel 1 is a no brainer.
Vice versa for panel 3 and 4.
Thus I thought of a method for quantifying raggedness of price action, and autocorr was the most intuitive one. It exactly captures raggedness/messiness/volatility. Combine that with linear regression coefficient for direction and we have a good enough trend indicator.
How to interpret the autocorr and linreg values that I post HERE :
1. AC>0 & LR>0 : Smooth Uptrend
2. AC<0 & LR >0 : Volatile Uptrend
3. AC <0 & LR <0 : Volatile Downtrend
4. AC >0 & LR <0 : Smooth Downtrend
I use a 5 day window for calculating both and a 1 day lag for autocorr.
You can play around with other windows and lags to get your curve fit right.
Hope this helps. Toodles.
Pingback: Nifty BTST blurb - Alpha Leaks
Hi, Can you please describe how you have calculated AR and LR?
Most languages have built in functions for these. In R, it is “acf” and “lm”.
Hello. Fabulous articles, thank you! I have couple of questions
– for autocorr, what is series did you consider? In trading view, there’s a “ta.correlation” function defined as
“`Correlation coefficient. Describes the degree to which two series tend to deviate from their ta.sma values.
ta.correlation(source_series, target_series, length) → series float“`
I tried with `autocorr = ta.correlation(hlc3, hlc3[1], 5)`
where, hlc3 = (candle_hi + candle_low + candle_close)/3
I also tried with just ‘close’ of candle.
But my 11 aug value is not matching yours. Mine is -0.01 for nifty on 11/8
Could you please share where I might be going wrong?
– For liner reg, what value did you use for SMA smoothening of the curve?
Thanks man.
I used the autocorr on close values only. The value you have to take is the 1D lagged value. At least that’s what I tested. I don’t know what the ta.correlation does, but it definitely is different from pure autocorr on the same time series. Autocorr functions are provided in all programming languages. I used the acf function of R. https://www.rdocumentation.org/packages/stats/versions/3.6.2/topics/acf for documentation of the same.
For Linreg, no smoothening is required. Just plug in the close values (C2C returns are better) with number of days as “x” and you’ll get the per day change as the coefficient.
Pingback: Stock trend Backtest using AC and LR criteria - Alpha Leaks
Pingback: Stock Trend Screener - Alpha Leaks
Pingback: Stock Bounce Screener – the Backtest - Alpha Leaks